
Revenue leaders want to truly understand what happened — and quickly steer the team toward stronger performance. That’s where HubSpot sales analytics comes in. In this post, we break down the metrics that matter, what HubSpot reporting can and can’t do, and how to unlock real-time insight into win rates, slippage, and pipeline efficiency.
What’s Breaking Sales Performance — And How HubSpot Sales Analytics Helps Fix It
Sales leaders are facing a growing list of performance challenges — and surface-level dashboards aren’t cutting it anymore.
Win rates are falling. Across B2B sales, fewer deals are closing, even as teams increase effort.
Sales cycles are stretching. Deals are taking longer to move through the pipeline, dragging out forecasts and reducing predictability.
Pipeline efficiency is declining. Reps are creating activity, but not always traction. Top performers win because they focus on better-qualified accounts — not just more tasks.
Pipeline coverage is shrinking. Many teams report fewer qualified opportunities entering the funnel each month.
Deal size is stagnating. Even when deals close, average contract value often falls short of targets.
These aren’t just execution problems — they’re visibility problems. Without clear analytics, it’s nearly impossible to diagnose what’s really changing in the pipeline and what levers to pull.
That’s where HubSpot sales analytics comes in. By going beyond basic reporting, modern analytics tools help revenue teams identify the trends, friction points, and conversion gaps hiding inside their CRM — before it’s too late to act.
What HubSpot Sales Analytics Can (and Can’t) Do Natively
HubSpot Sales Analytics provides built-in dashboards like:
Average time spent per deal stage (closed deals only)
Deal pipeline waterfall and snapshots
But limitations remain:
Metrics are limited to closed deals, excluding in-progress pipeline
No correlation between activity and outcome, critical for coaching
Difficult to analyze slippage, velocity, or conversion ratios by stage
Cross-object depth (e.g., combining deals, contacts, activities) requires manual exports or workarounds
The Five Metrics That Matter Most in Sales Analytics
To improve sales performance, revenue teams need to go deeper than surface-level dashboards. The following five metrics consistently separate high-performing teams from the rest — but most are hard to access or visualize with native HubSpot reporting alone.
1. Win Rate Trends
Your win rate isn’t static — it fluctuates based on pipeline quality, deal prioritization, and sales execution. Declining win rates often signal hidden issues in qualification or follow-up. But in HubSpot, tracking win rate over time across teams, deal types, or lead sources requires custom workarounds.
2. Time in Stage & Deal Slippage
Stalled deals are one of the clearest signs of risk — but they’re often overlooked. Measuring how long deals stay in each pipeline stage (and whether they’re slipping past expected close dates) is critical for proactive coaching. HubSpot’s Time in Stage metric only applies to closed-won deals, leaving a gap in visibility for the active pipeline.
3. Funnel Leakage by Stage
It’s not enough to know your pipeline size — you need to see where deals drop out. Funnel leakage analytics reveal stage-by-stage fallout, helping you focus effort where it’s most needed. In HubSpot, tracking stage exits vs. entries over time typically requires spreadsheet exports or external tools.
4. Deal Velocity
How long does it really take to close a deal? Deal velocity — the average time from qualification to close — is directly tied to forecasting accuracy and pipeline health. HubSpot shows basic pipeline duration metrics, but it doesn’t tie velocity to outcomes like win rate or conversion quality.
5. Activity-to-Outcome Correlation
Not all activity is productive. The most effective sales teams know which actions — meetings, calls, emails — actually drive progress. HubSpot logs sales activity, but lacks native reports connecting those efforts to closed revenue or movement through the funnel.
Learn more in the Complete Guide to HubSpot Reporting
Sales Performance Analytics That Top Teams Rely On
Sales analytics isn’t about seeing where your pipeline stands today — it’s about understanding what’s changing in your pipeline and why. Here’s an example of what high-impact sales metrics look like when they’re surfaced clearly in a real-time dashboard.
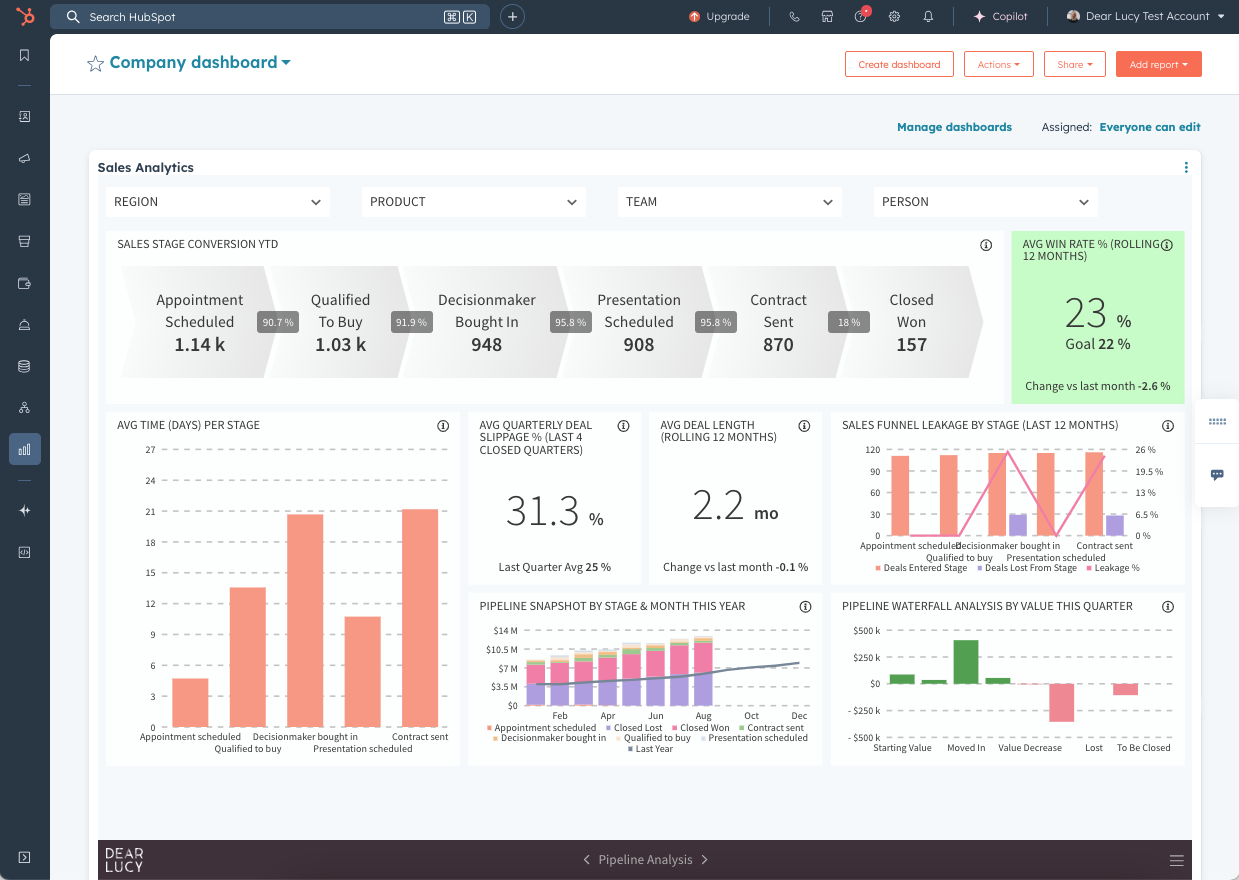
Win Rate vs. Goal
A rolling 12-month view of win rates, benchmarked against team or company goals — with traffic-light indicators to flag whether you're on track, falling behind, or outperforming.
Read more about how to set and track goals in HubSpot
Average Time per Stage
Highlights where deals are stalling. If time spent in early stages creeps up, it’s a clear signal to review qualification criteria or early-stage activities.
Deal Slippage Rate
Tracks how many deals are pushed forward in close date or regress in pipeline stage — a critical risk indicator for forecast accuracy and sales momentum.
Pipeline Snapshot
Shows total pipeline value broken down by stage — compared to historical data (e.g., the same month last year) to assess growth, consistency, or early signs of pipeline shrinkage.
Stage Leakage
Visualizes how many deals enter a stage vs. how many exit successfully. If 80% of deals in Proposal Stage are lost or stalled, it’s time to rework that part of the process.
HubSpot + Dear Lucy: Advanced Sales Analytics Without the Spreadsheets
Why native tools fall short
HubSpot’s built-in analytics give you a good starting point — but they miss critical signals that drive revenue performance. You won’t get live slippage tracking, activity-to-outcome insights, or trend-based alerts without heavy manual work. And exporting to spreadsheets? It’s slow, error-prone, and quickly outdated.
Dear Lucy fills the gap
Dear Lucy enhances HubSpot sales analytics with advanced metrics built for real-world decision-making — no extra tools or spreadsheets needed.
What you get:
Win rate trends by rep, team, region, or business unit
Deal velocity and slippage tracking — across open and closed pipeline
Waterfall views to analyze stage-to-stage leakage over time
Activity correlation insights — showing which actions actually drive outcomes
Real-time pacing alerts when metrics start falling behind
All of it visualized inside your HubSpot dashboards — and easily shared with execs or board members (no CRM access required).
How Sales Teams Use Analytics Every Week
Sales analytics isn’t just for end-of-quarter reports — top-performing teams use these metrics to run weekly workflows that drive performance and accountability.
Sales Reps
Use deal scoring and pipeline trend dashboards during 1:1s to prioritize focus and get coaching on at-risk deals.
Sales Leaders
Run forecast calls and pipeline reviews using live win rate, slippage, and coverage data to validate rep inputs and adapt strategy before it’s too late.
RevOps & Managers
Analyze funnel leakage and stage performance across teams or segments to uncover process issues or coaching needs.
Executives & CROs
Review board-ready dashboards with performance trends, conversion metrics, and risk alerts — no CRM login required.
The result: smarter coaching, faster adjustments, and more accurate revenue predictions across the entire sales org.
See examples for Actionable HubSpot Dashboards
Final Thoughts: Why Sales Analytics is the Lifeline You Need
If you're using HubSpot but still relying on piecemeal dashboards or post-period Excel exports, you're missing the story of your pipeline. HubSpot sales analytics by Dear Lucy go beyond rolling numbers — they reveal what’s working and what needs fixing.
With Dear Lucy, you get automated insight, accurate win-rate tracking, and real-time pipeline health — all embedded inside HubSpot.
Ready to start diagnosing pipeline inefficiencies today?
Frequently Asked Questions (FAQ)
Can I track sales analytics in HubSpot?
Yes, HubSpot includes a native Sales Analytics tool with basic dashboards like pipeline snapshots and time-in-stage reports. However, it’s limited to closed deals and doesn’t surface trends like slippage, win rate changes, or activity-to-outcome correlation.
What KPIs should I monitor for better sales performance?
High-performing teams track win rate trends, deal velocity, slippage rates, funnel leakage, and activity-to-outcome ratios. These go beyond surface-level dashboards to show what’s actually driving or blocking pipeline progress.
Does HubSpot show slippage or deal velocity?
Not natively. HubSpot offers limited insights into pipeline movement. With tools like Dear Lucy, you can monitor live deal slippage, average time in stage, and how pipeline velocity is affecting forecasting and conversion rates.
How do I improve sales analytics inside HubSpot?
You can enrich your HubSpot CRM with smarter dashboards using Dear Lucy — enabling predictive analytics, live pacing alerts, and visual performance metrics without spreadsheets or manual setup.
TL;DR: HubSpot Sales Analytics — Smarter Insights, Better Sales Decisions
Sales teams are facing falling win rates, longer cycles, and declining pipeline efficiency.
HubSpot’s built-in analytics offer a starting point, but miss key trends like slippage and velocity.
Dear Lucy enhances your HubSpot sales analytics with win-rate tracking, activity insights, and funnel diagnostics — built directly into your CRM.
The result? More accurate forecasting, faster coaching, and data-driven sales execution.
About Dear Lucy
Dear Lucy is a certified HubSpot App Partner helping sales-led companies go beyond static dashboards. With plug-and-play sales analytics, predictive forecasting, and CRM hygiene dashboards, Dear Lucy turns your HubSpot CRM into a full revenue performance engine.
✔ Visual dashboards embedded inside HubSpot
✔ Predictive forecasts, deal scoring, and pacing alerts
✔ MRR/ARR and recurring revenue tracking
✔ Role-based views for reps, managers, and execs
✔ Trusted by scaling B2B sales teams in over 25 countries