
Every SaaS board meeting revolves around the same numbers:
ARR
MRR
Net Revenue Retention (NRR)
Gross Revenue Retention (GRR)
Expansion vs churn
Revenue per customer
Growth vs target
The challenge isn’t defining these metrics.
It’s seeing them — structured, segmented, and reliable — inside HubSpot.
That’s where HubSpot MRR reporting becomes critical.
Most SaaS teams technically have the data. Recurring revenue lives in Deal Line Items, deal properties, or custom fields. But when leadership asks:
What’s our true ARR right now?
How much growth came from expansion?
What did churn actually cost us last quarter?
How does recurring revenue look by product, region, or business unit?
That’s where HubSpot MRR reporting often breaks down.
Data exists. Structure doesn’t.
This guide explains:
Which SaaS KPIs matter at CEO, CRO, and board level
How recurring revenue should be structured inside HubSpot
How Deal Line Items and revenue fields can power a board-ready SaaS revenue dashboard — without spreadsheet rebuilds or manual exports
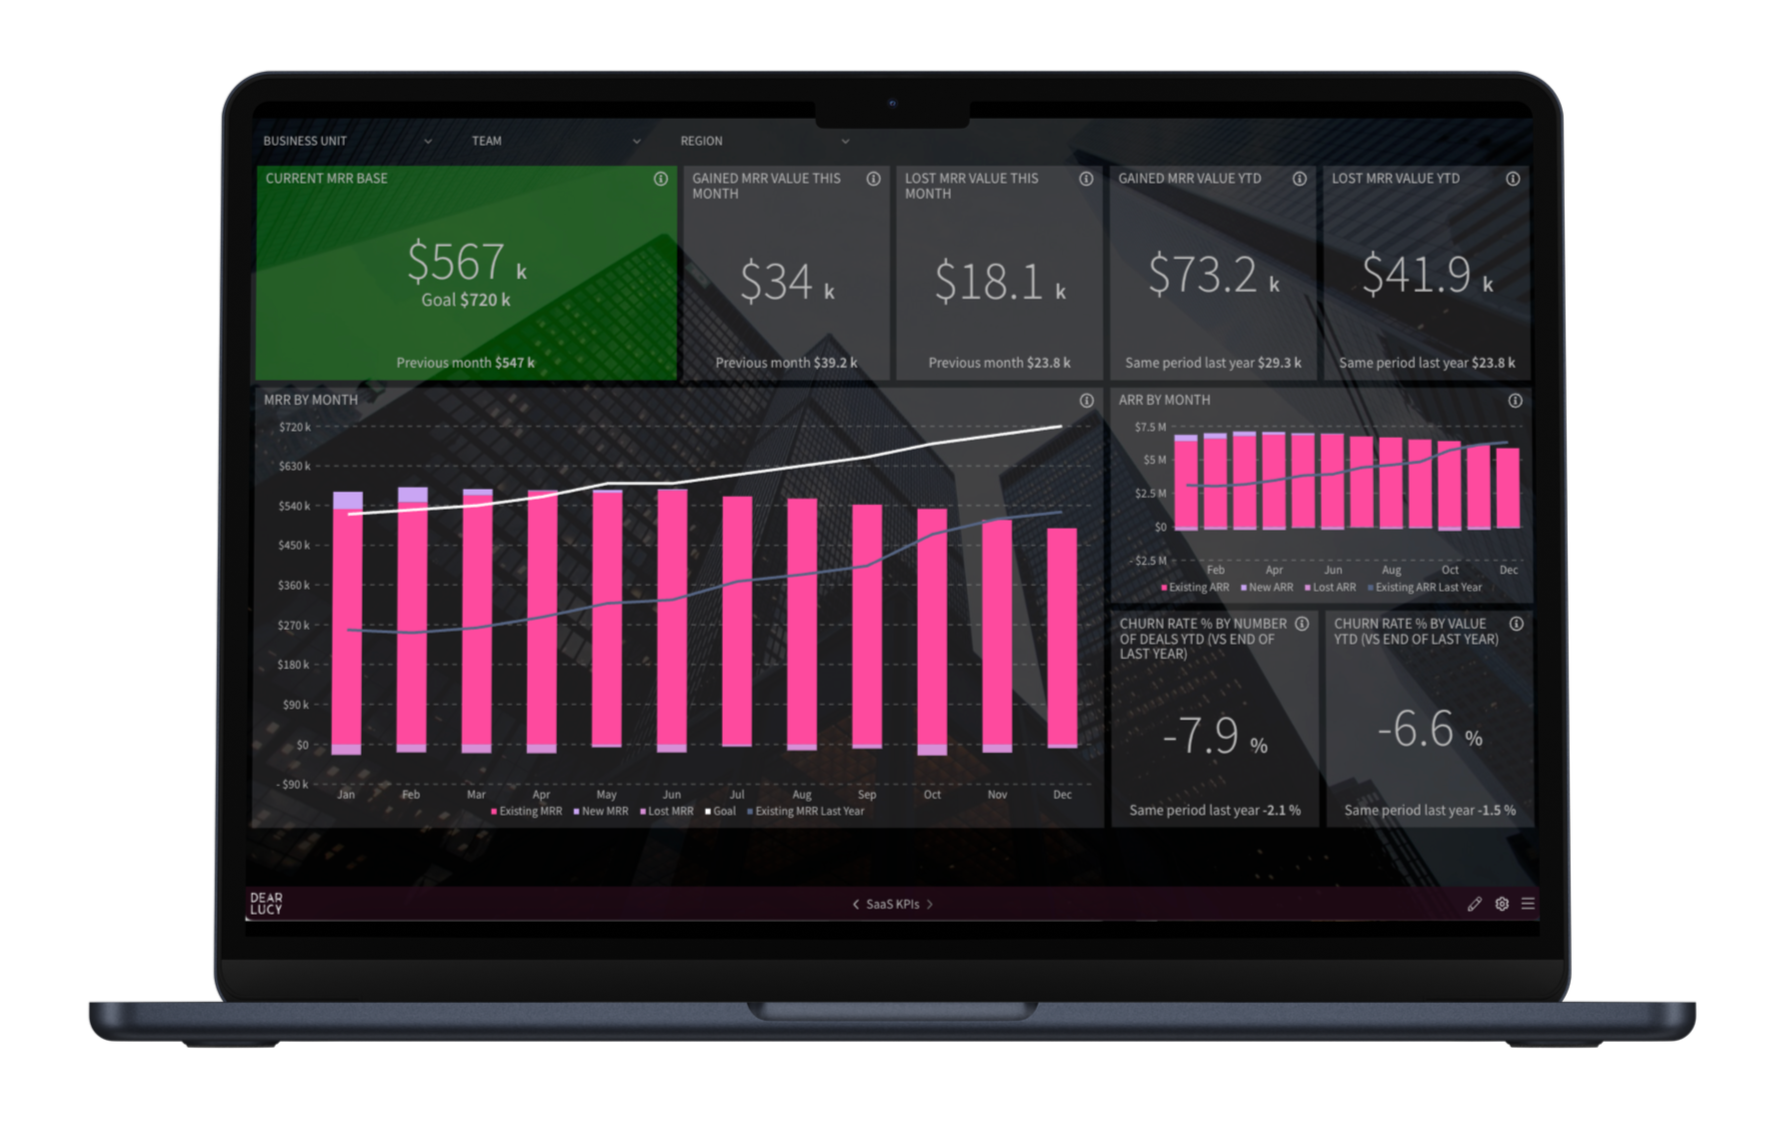
Example: Executive SaaS KPI dashboard showing ARR, MRR movement, churn, and goal tracking inside HubSpot.
The SaaS KPIs Your Board Actually Cares About
If your HubSpot MRR reporting doesn’t clearly show these metrics, it’s incomplete.
1. ARR (Annual Recurring Revenue)
ARR is the backbone of SaaS valuation and strategic planning.
Your HubSpot ARR reporting dashboard should show:
Total ARR
ARR trend over time
ARR by segment (region, product, business unit)
ARR vs target
ARR answers:
Are we building durable, predictable revenue?
If ARR visibility requires manual exports from HubSpot or custom spreadsheet modeling, you don’t have control — you have lag.
2. MRR (Monthly Recurring Revenue)
MRR is your operational heartbeat.
But seeing one total number in HubSpot isn’t enough.
A proper HubSpot recurring revenue reporting setup separates:
New MRR
Expansion MRR
Contraction MRR
Churned MRR
Without that breakdown, growth looks better — or worse — than reality.
MRR should explain movement, not just totals.
3. Net Revenue Retention (NRR)
NRR shows whether you are growing inside your existing customer base.
Strong SaaS companies typically operate at:
100–110% = stable
110–120% = strong
120%+ = elite
Your recurring revenue dashboard should display:
NRR trend over time
Expansion vs churn impact
NRR by segment
NRR is often more predictive of long-term success than new logo sales alone.
4. Gross Revenue Retention (GRR)
GRR isolates churn and contraction — without counting expansion.
It answers:
Is the product sticky?
If GRR weakens, expansion can temporarily hide structural issues. That’s why boards and investors look closely at this metric.
5. Churn (Logo & Revenue)
Churn must be segmented properly.
A meaningful HubSpot SaaS dashboard separates:
Logo churn
Revenue churn
Churn by cohort
Churn by product
If churn is blended into generic revenue reporting, risk becomes invisible.
6. Revenue Per Customer (ARPA)
Revenue per account reveals monetization strength.
Your dashboard should show:
Average revenue per account
ARPA by segment
ARPA trend over time
This helps leadership evaluate pricing power and expansion effectiveness.
7. Customer Acquisition Cost (CAC)
ARR tells you how fast you’re growing.
CAC tells you how expensive that growth is.
Even if recurring revenue is structured perfectly in HubSpot, leadership still needs visibility into how much it costs to acquire new customers.
Your SaaS dashboard should show:
Total sales and marketing cost
CAC by segment (SMB vs enterprise)
CAC trend over time
In many SaaS companies, cost data lives outside HubSpot — often in finance systems or spreadsheets. That data can be connected via structured imports or custom objects to complete the revenue picture.
Without CAC visibility, ARR growth can look impressive while capital efficiency quietly deteriorates.
8. CAC Payback & LTV/CAC Ratio
Recurring revenue and acquisition cost only make sense when viewed together.
CAC Payback Period
How long does it take recurring revenue to recover acquisition cost?
LTV/CAC Ratio
Is the long-term value of customers meaningfully higher than what it costs to acquire them?
Healthy SaaS companies typically aim for:
CAC payback under 12–18 months
LTV/CAC ratio around 3:1 or higher
These metrics are not calculated from HubSpot revenue alone — they require combining recurring revenue data with cost inputs. When structured correctly, HubSpot revenue reporting can form the foundation of these capital efficiency metrics.
Boards don’t just evaluate growth.
They evaluate growth quality.
Why Native HubSpot MRR Reporting Falls Short
HubSpot is an excellent system of record.
You can structure recurring revenue in multiple ways — using deal line items, deal properties, recurring revenue fields, or even custom objects connected from finance systems.
The data can live in HubSpot.
The challenge is reporting on that data in a way that reflects real SaaS metrics.
Native revenue reports focus on tracking recurring revenue events. But executive SaaS dashboards require:
Clean separation of recurring vs one-time revenue
Clear expansion vs churn movement
Structured ARR and MRR trends
Segmentation by product, region, or business unit
Board-ready visibility
HubSpot collects the data well.
Turning that data into a structured SaaS revenue dashboard is a different layer.
Recurring vs One-Time Revenue: The Non-Negotiable Split
For SaaS companies, separating recurring and non-recurring revenue is foundational.
Recurring Revenue (MRR / ARR)
Subscription revenue that forms predictable growth.
One-Off Revenue
Implementation, onboarding, setup, services, or custom work.
If these are blended:
ARR becomes misleading
Board reporting loses credibility
Revenue forecasting becomes unstable
A proper HubSpot MRR reporting structure enforces this split automatically — whether data lives in deal line items, custom properties, or structured objects.
If you're using Deal Line Items in HubSpot and want practical setup guidance, see our step-by-step guide on How to Set Up HubSpot Line Item Reporting in Dear Lucy.
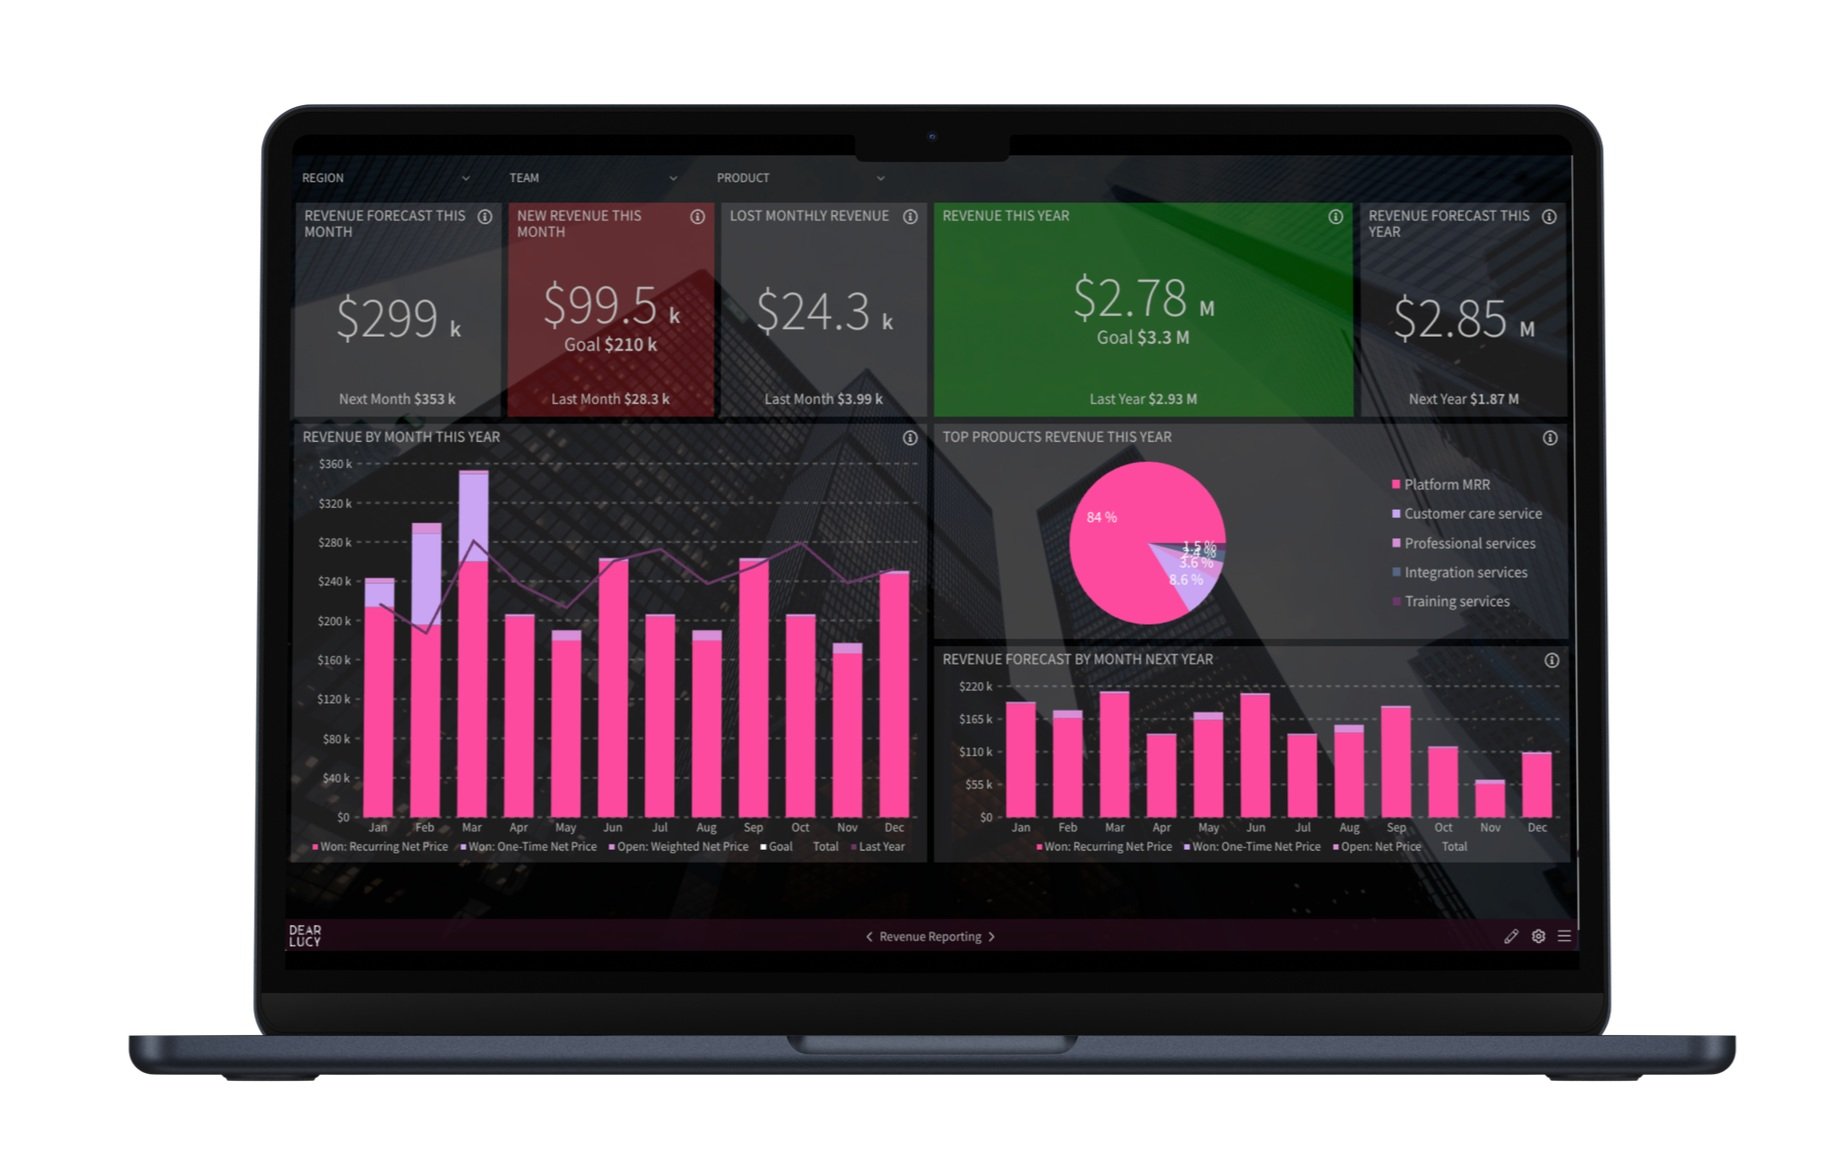
Example: Executive dashboard separating recurring and one-time revenue, including ARR, MRR trends, and product segmentation.
Where MRR Data Lives in HubSpot
Recurring revenue data can be structured in multiple ways:
Deal properties
Custom deal properties
Deal Line Items
Custom objects
The right architecture depends on your contract structure and reporting needs.
What matters most is consistency.
If expansion, churn, and revenue type are not consistently defined, SaaS KPIs will break regardless of technical setup.
Structure first. Tools second.
What a Board-Ready HubSpot SaaS Revenue Dashboard Looks Like
When recurring revenue is structured properly, HubSpot data should power:
Live ARR overview
MRR movement waterfall (new, expansion, churn)
NRR and GRR trend lines
Revenue segmentation by region or product
ARR vs target pacing
Expansion and churn breakdown
No manual exports.
No formula patches.
No spreadsheet reconciliation.
Just clarity.
If you’re looking for practical guidance on layout and structure, see our guide on How to Build an Actionable HubSpot Dashboard (the Right Way).
How Revenue Leaders Use Structured HubSpot MRR Reporting
CROs monitor expansion vs churn in real time.
CFOs track ARR composition and recurring revenue durability.
RevOps ensures revenue classification remains consistent across teams.
Boards receive clean, visual SaaS metrics dashboards built from HubSpot data.
Recurring revenue visibility isn’t just reporting.
It’s revenue control.
HubSpot MRR Reporting vs Revenue Forecasting
It’s important to distinguish between two related but different concepts.
MRR Reporting
Focuses on recurring revenue structure — what exists today and how it is composed.
Revenue Forecasting
Focuses on predicting future outcomes based on pipeline probability, scheduled revenue, and deal progression.
Both matter.
But they solve different executive problems.
If you’re specifically looking to improve forecast accuracy or predictive revenue modeling in HubSpot, see our HubSpot Revenue Forecasting guide.
FAQ
Can this be used for board reporting?
Yes.
A properly structured SaaS KPI dashboard should be clear enough for board presentations — showing ARR trends, MRR movement, NRR, churn, segmentation, and progress vs targets in one visual view.
Board members can access live dashboards at any time to track performance between meetings.
You can also share scheduled snapshot reports via email or use the live dashboard directly during board presentations.
Board reporting requires clarity — not last-minute spreadsheet exports. The goal is controlled, real-time visibility.
Can I track SaaS KPIs against goals?
Yes.
A structured SaaS KPI dashboard should not only show ARR, MRR, NRR, and churn — it should also track performance against clearly defined targets.
You should be able to:
Set company-level ARR and growth goals
Track pacing against targets in real time
Break goals down by business unit, region, or team
Monitor whether expansion and new business are aligned with plan
Goal tracking turns recurring revenue reporting into revenue management.
Without pacing visibility, ARR is just a number.
With structured goal tracking, it becomes a performance system.
Can this support multiple currencies?
Yes.
Recurring revenue dashboards can consolidate multiple currencies into a single reporting currency while still allowing local views when needed.
For international SaaS companies, currency normalization is essential for accurate ARR, NRR, and board-level reporting.
Can we segment KPIs by product, region, or customer type?
Yes.
Executive SaaS reporting should allow segmentation by:
Product line
Region
Business unit
Customer segment (SMB, mid-market, enterprise)
Segmentation is critical for understanding where growth is durable — and where risk is building.
Can this replace our monthly revenue spreadsheet?
For executive recurring revenue reporting — yes.
Spreadsheets are useful for deep analysis, but they are fragile as a system of record.
A structured SaaS KPI dashboard reduces manual exports, reconciliation work, and version control risk.
Does this work for complex SaaS contracts?
Yes.
Whether revenue is structured through Deal Line Items, custom deal properties, or custom objects, the key requirement is consistent recurring revenue classification.
Complex contract structures — including upgrades, downgrades, renewals, and amendments — require structured logic to ensure ARR and MRR reporting remain reliable over time.
How often should recurring revenue dashboards update?
In fast-growing SaaS companies, dashboards should update automatically — ideally hourly.
Waiting for month-end reporting introduces lag and limits leadership’s ability to course-correct.
Is this suitable for venture-backed or PE-backed SaaS companies?
Yes.
Investors expect visibility into:
ARR growth
Net Revenue Retention
Churn
CAC efficiency
Progress vs targets
A structured SaaS KPI dashboard ensures leadership and investors are aligned on the same real-time revenue picture.
TL;DR
HubSpot stores recurring revenue data — but native reporting often fails to structure it properly for executive SaaS metrics.
Accurate HubSpot MRR reporting requires:
Clear recurring vs one-time splits
Separation of expansion, contraction, and churn
Consistent revenue classification
Structured ARR and MRR dashboards
Board-ready visibility
When implemented correctly, HubSpot becomes a reliable SaaS revenue engine — without spreadsheets.
About Dear Lucy
Dear Lucy is a Sales Performance Management platform built for SaaS companies using HubSpot, Salesforce, or Pipedrive.
It transforms CRM data — including Deal Line Items and recurring revenue fields — into structured SaaS KPI dashboards.
Instead of fragmented exports and manual modeling, revenue leaders get:
ARR and MRR tracking
Expansion vs churn visibility
NRR and GRR trends
Segmented recurring revenue dashboards
Predictable growth starts with predictable visibility.
Dear Lucy is a certified HubSpot partner, purpose-built for HubSpot users who need structured SaaS KPI dashboards beyond native reporting. Learn more about Dear Lucy for HubSpot.