
Why HubSpot Reporting Matters
If you’re a sales leader, RevOps pro, or founder using HubSpot CRM, one thing becomes clear fast: your reporting setup makes or breaks your sales performance.
HubSpot is a delight to use for pipeline management — intuitive, customizable, and fast-moving. But when it comes to sales reporting, teams often hit a wall. The built-in tools are good, but sometimes you need more clarity, customization, or forecasting horsepower to truly drive decisions.
This guide is built for HubSpot’s sales ecosystem — and the people who want real answers from their CRM.
See HubSpot Reporting in Action - Start Free Trial
HubSpot’s Built-In Reporting Features
Let’s start with the good news: HubSpot offers a solid foundation for CRM reporting, especially for smaller teams or standard dashboards.
Here’s what’s included:
Report & Dashboard Builder — Works across Deals, Activities, Contacts, Companies, Line Items, and Products
Pre-built Templates — For pipeline, performance, and revenue reporting
Custom Report Builder — Drag-and-drop creation with filters and formulas
Interactive Reports — Sort, segment, and filter live CRM data
Forecast Cards & Attribution Insights — Visualize sales targets and source impact
That said, setup often requires defining pipelines, custom properties, and filters — and more advanced use cases typically need a HubSpot partner or RevOps support. HubSpot is flexible, but when teams need deeper insights like predictive forecasting, goal pacing, or recurring revenue tracking, they often look beyond native tools.
Common Limitations (and Workarounds)
As your sales team scales, even HubSpot’s reporting tools can start to feel limiting:
Forecasting: Built-in forecasts rely on deal stage probabilities — but there’s no predictive modeling, pacing trends, or hierarchy management for complex teams. Many fall back on spreadsheets or external tools.
Goal Tracking: You can set rep or team goals, but can’t track pacing, leaderboards, or advanced KPIs (like conversion rate or meetings held). Multi-level tracking across reps, teams, and business units often requires workarounds.
Pipeline Analytics: Key insights like funnel conversion, time in stage, and deal velocity aren’t easily accessible. These are essential for performance coaching and revenue predictability.
CRM Hygiene: Issues like overdue tasks, missing fields, or inactive deals go unnoticed. Without data quality monitoring, forecast accuracy declines fast.
Recurring Revenue (MRR/ARR): While HubSpot stores recurring revenue via Line Items, it doesn’t separate recurring vs. one-time revenue, show churn/expansion trends, or offer a monthly MRR view — leading many to build spreadsheets.
Dashboard Scalability: HubSpot caps dashboards at 30 reports each (100 total). As teams grow, maintaining dashboards for forecasts, rep performance, and data hygiene becomes time-consuming.
Bottom line: HubSpot reporting covers the basics — but when teams need more powerful sales dashboards, advanced forecasting, or automated performance tracking, tools like Dear Lucy fill the gap fast.
HubSpot Reporting Examples: What Great Sales Dashboards Look Like
The best HubSpot reporting isn’t just a pile of graphs — it’s clarity, accountability, and action. Here’s what great looks like when your dashboards are built for real sales use cases:
Learn more in HubSpot dashboard setup guide for sales teams
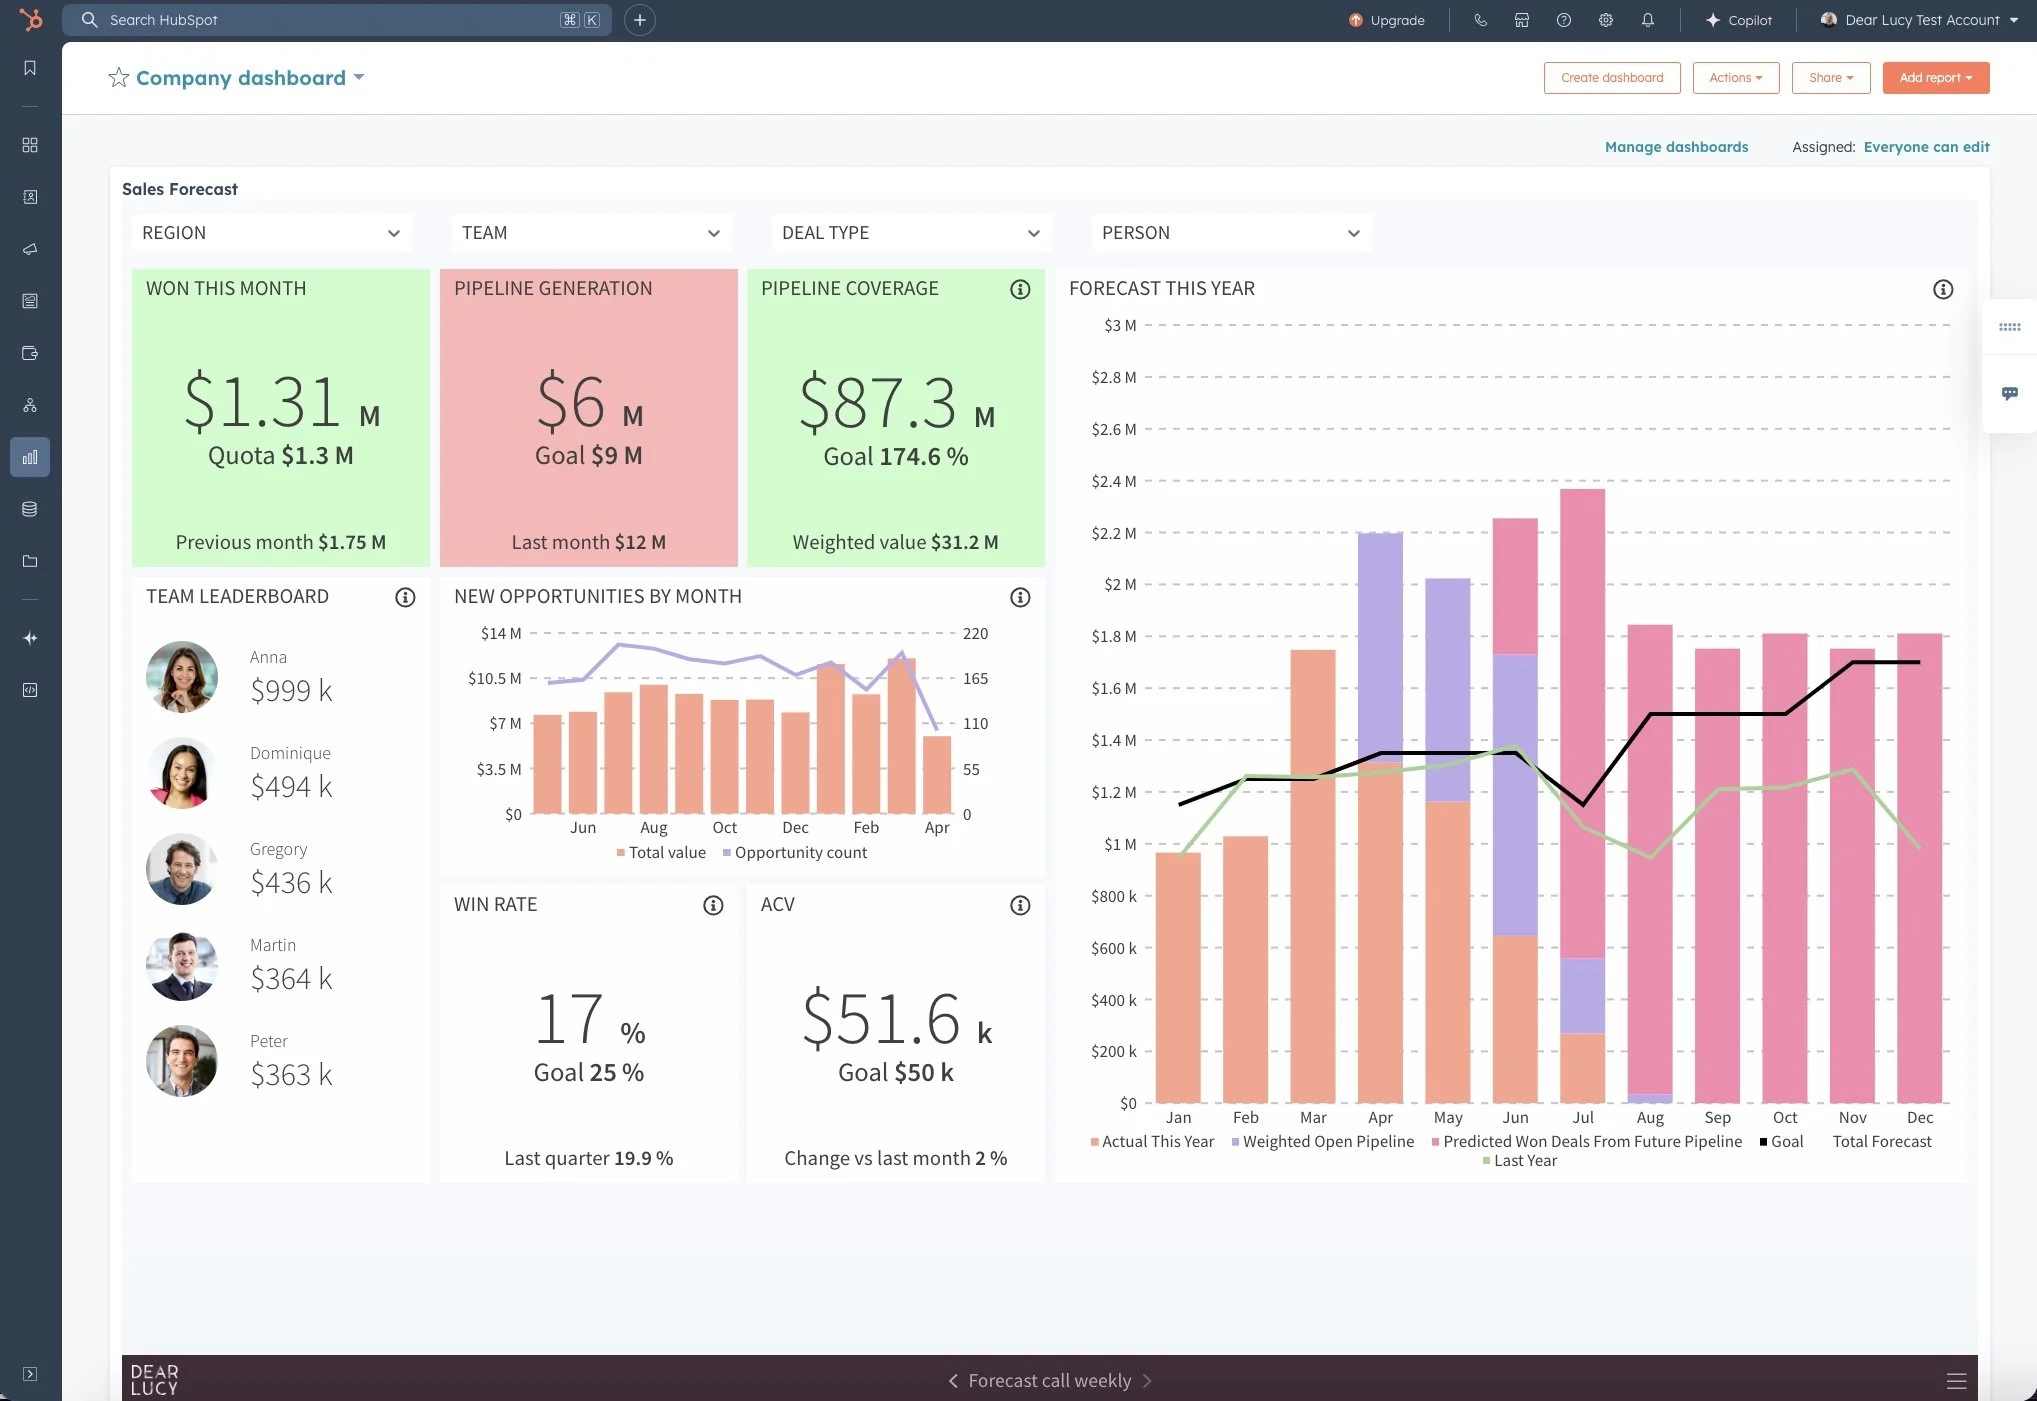
Sales Forecast Dashboard
Your forecasting should do more than show deal totals. A robust HubSpot reporting setup includes:
Forecast vs. actual comparisons across time, teams, and targets
Predictive forecasting based on historical sales behavior — not just deal stage probability
Pacing trends and alerts that show whether you’re on track to hit goals
Filters by rep, region, pipeline, or business unit — ideal for multi-team organizations

Goal Tracking and Performance
High-performing HubSpot reporting doesn’t just track rep-level quotas — it drives action, accountability, and better decisions at every level. A strong setup includes:
Flexible goal-setting across any KPI — from MRR growth and pipeline coverage to meetings booked and win rates
Targets at every level — rep, team, business unit, and company-wide
Real-time performance tracking with traffic light indicators to flag when metrics are off-track or surging ahead
Live leaderboards to fuel motivation and healthy competition
Trend insights over time, so coaching is based on patterns — not just outcomes
→ Want to go deeper? Learn how to set and track layered sales goals in HubSpot
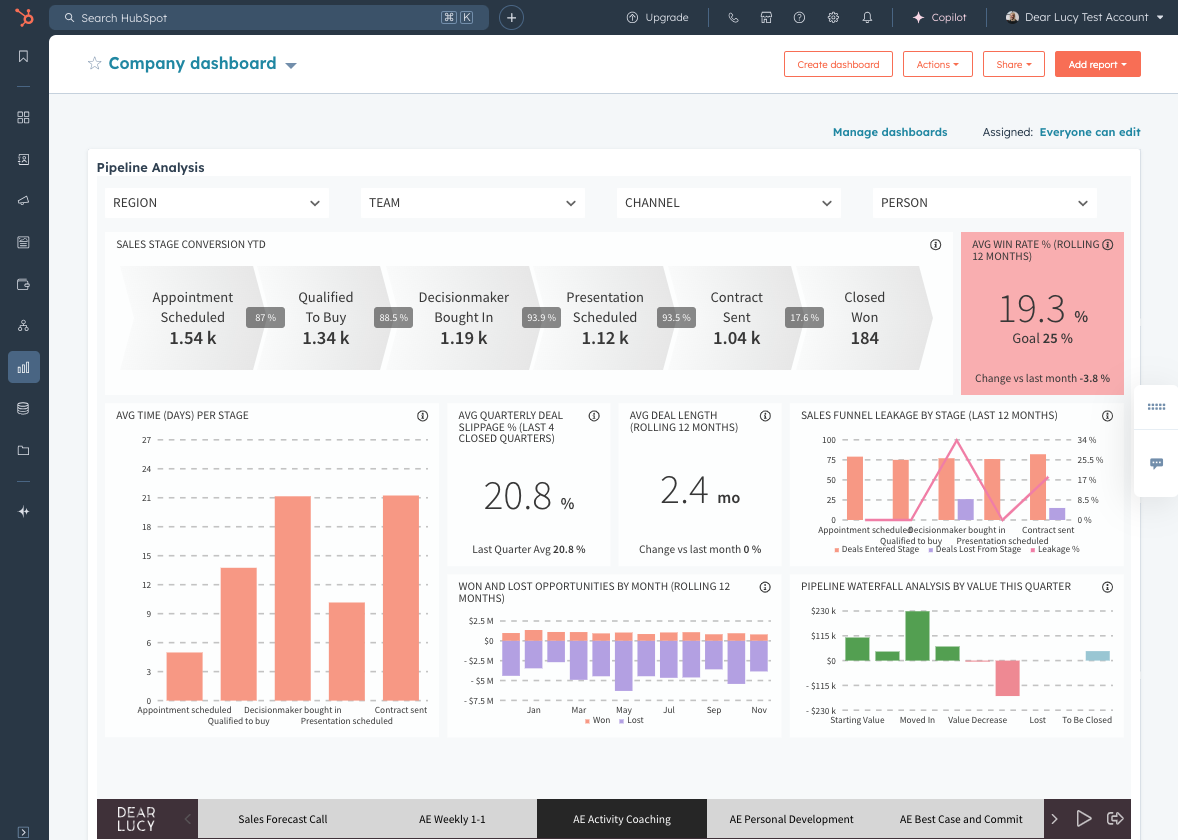
Sales Analytics Overview
HubSpot holds powerful data — but transforming it into insights takes the right setup. High-impact HubSpot reporting should deliver:
Funnel conversion tracking — from lead to close, with clear conversion ratios between stages
Sales cycle insights — average time spent per stage, total deal length, and quarterly slippage trends
Activity-to-outcome correlation — understanding how meetings, emails, and calls impact pipeline growth
Pipeline snapshots — visibility into how open pipeline value changes over time and whether you have enough coverage to hit targets

CRM Data Hygiene Dashboards
Even the best sales strategy breaks down without clean CRM data. That’s why top-performing teams monitor data hygiene directly in their HubSpot dashboards.
Dashboards like the Wall of Shame help identify:
Deals stuck in pipeline stages for months
Activities logged without outcomes
Overdue or ignored tasks
Reps with outdated or incomplete deal info
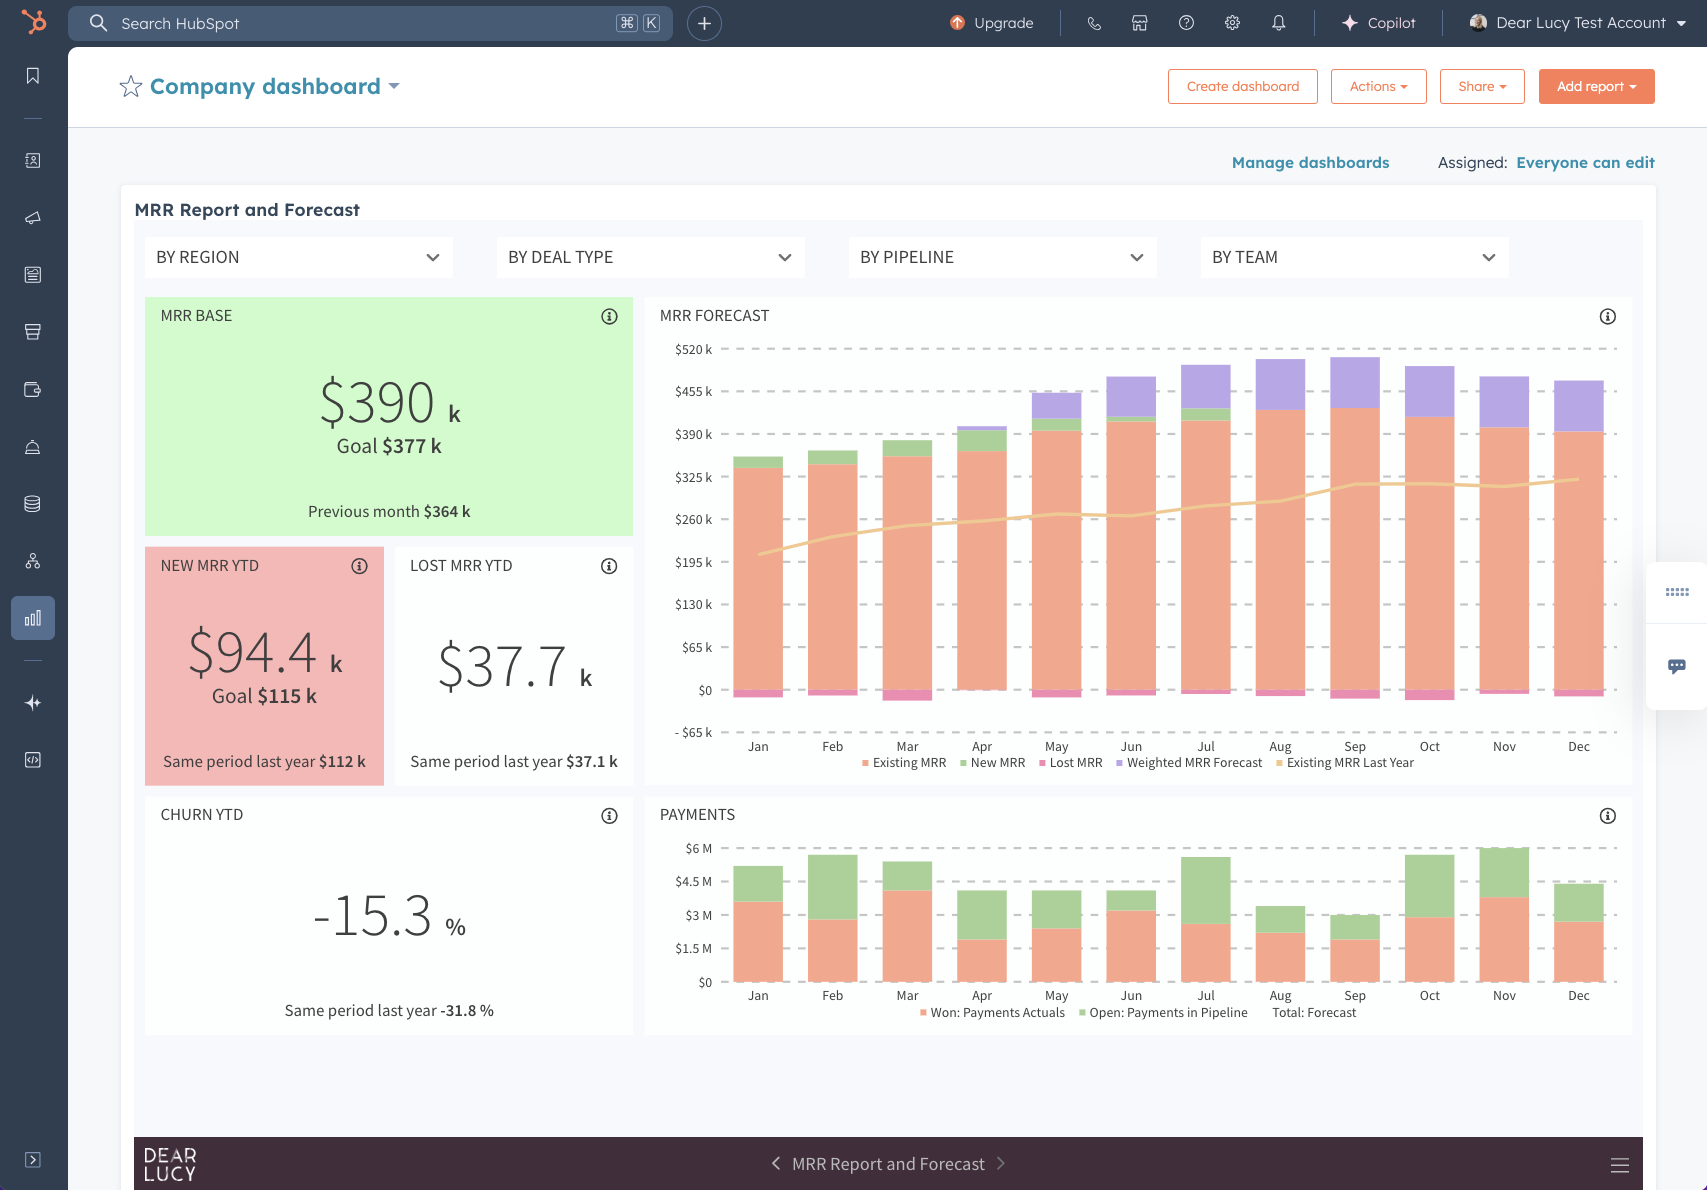
MRR/ARR Reporting View
Tracking recurring revenue in HubSpot can be tricky — especially when you need clarity between subscription and one-time revenue. A well-structured HubSpot reporting setup should include:
Recurring vs. one-time revenue breakdown in a single dashboard
Monthly MRR visibility, showing how recurring revenue grows or declines over time
Churn, contraction, and expansion tracking based on Line Item changes
Revenue segmentation by product, customer, or region
Support for hybrid revenue models — including project-based or usage-based billing
HubSpot stores recurring revenue via Line Items, but without custom setup or third-party tools, you can’t easily break out the key metrics. That’s why many teams use solutions like Dear Lucy to unlock a clean, accurate monthly MRR view — and stop relying on spreadsheets.
Read more: HubSpot MRR Reporting Guide
Use Case Inspiration: How Teams Actually Use HubSpot Reporting (With Dear Lucy)
Sales reporting isn’t just about dashboards — it’s how sales teams run their weeks, forecast accurately, coach effectively, and build trust with leadership.
When used right, HubSpot reporting becomes the foundation of performance conversations at every level of your organization.
Here’s how high-performing teams use role-based dashboards in their day-to-day and strategic routines:
SDRs & AEs
1:1 Check‑ins using activity dashboards (calls, meetings, emails vs outcomes)
Pipeline Progress Monitoring, with at-risk deal alerts
Conversion-focused coaching, powered by activity-to-outcome reporting and velocity trends
Sales Teams & RevOps
Team forecast calls, reviewing deal momentum, coverage gaps, and pacing trends
Pipeline analytics reviews, including funnel conversion ratios, deal velocity, slippage, and win/loss breakdowns
Pipeline health checks, identifying deals at risk using CRM hygiene dashboards (à la Wall of Shame)
Managers & Sales Leadership
Team performance dashboards with drill-downs by rep, region, or BU
Revenue forecasting & scenario planning using historical behaviors and custom scoring (e.g., commit, best-case)
KPI & activity comparisons, like quarterly forecasts vs actuals and rep win rates
CROs & the Boardroom
Executive dashboards presenting MRR, ARR, churn, expansion forecasting—no manual spreadsheets required
Review-ready investor summaries, with trusted metrics and predictive insights
Pipeline visibility across multiple tiers, simplified through cross-object dashboards and analytics
All of these use cases are fully supported by Dear Lucy’s dashboards — embedded right inside your HubSpot CRM. Sales teams access them where they already work, while leadership and boards can view dashboards directly on mobile, desktop, or even TV screens. Shared clarity, zero friction.
Frequently Asked Questions (FAQ)
Can I track MRR in HubSpot?
Not natively. But with Dear Lucy reading your line items, you get accurate MRR/ARR dashboards in minutes — no spreadsheets needed.
Can I build one dashboard with all key sales metrics?
Yes. Dear Lucy brings together deals, line items, activities, and goals into one clear view — ready to share with reps, managers, and execs.
What if we sell in multiple currencies?
No problem. Dear Lucy automatically normalizes your revenue so you can compare and forecast with confidence.
How easy is it to test?
Just start a free trial and connect your HubSpot portal. Dashboards are ready in minutes — no setup calls or complex configs.
Does it work for different business models?
Absolutely. Dear Lucy supports SaaS, services, product sales, or hybrid models with recurring and one-time revenue.
TL;DR: Smarter Sales Reporting Starts Here
HubSpot’s built-in reporting is a solid start. But when your sales org is scaling fast — and your metrics need to drive real action — it helps to go beyond the basics.
Dear Lucy gives you:
Dashboards for forecasts, recurring revenue, goals, and rep performance
Predictive forecasting with customizable deal scoring
Traffic light indicators for instant clarity on pacing and performance
All embedded right inside HubSpot — where your team already works
About Dear Lucy
Dear Lucy is a HubSpot Certified App Partner, helping sales teams unlock real-time forecasting, MRR tracking, goal setting, and analytics — all embedded directly in HubSpot.