
Sales Forecasting for Forecast Calls & Pipeline Reviews
Sales forecasting breaks down when forecast calls turn into storytelling, spreadsheet debates, or last-minute number changes.
Weekly pipeline reviews are where forecast accuracy is actually won or lost — yet most teams lack a clear, shared view of pipeline health and deal movement.
Dear Lucy gives sales teams sales forecasting dashboards built for both forecast calls and pipeline review meetings — so teams align faster, spot risk earlier, and make decisions with confidence.
One example of a sales forecasting dashboard
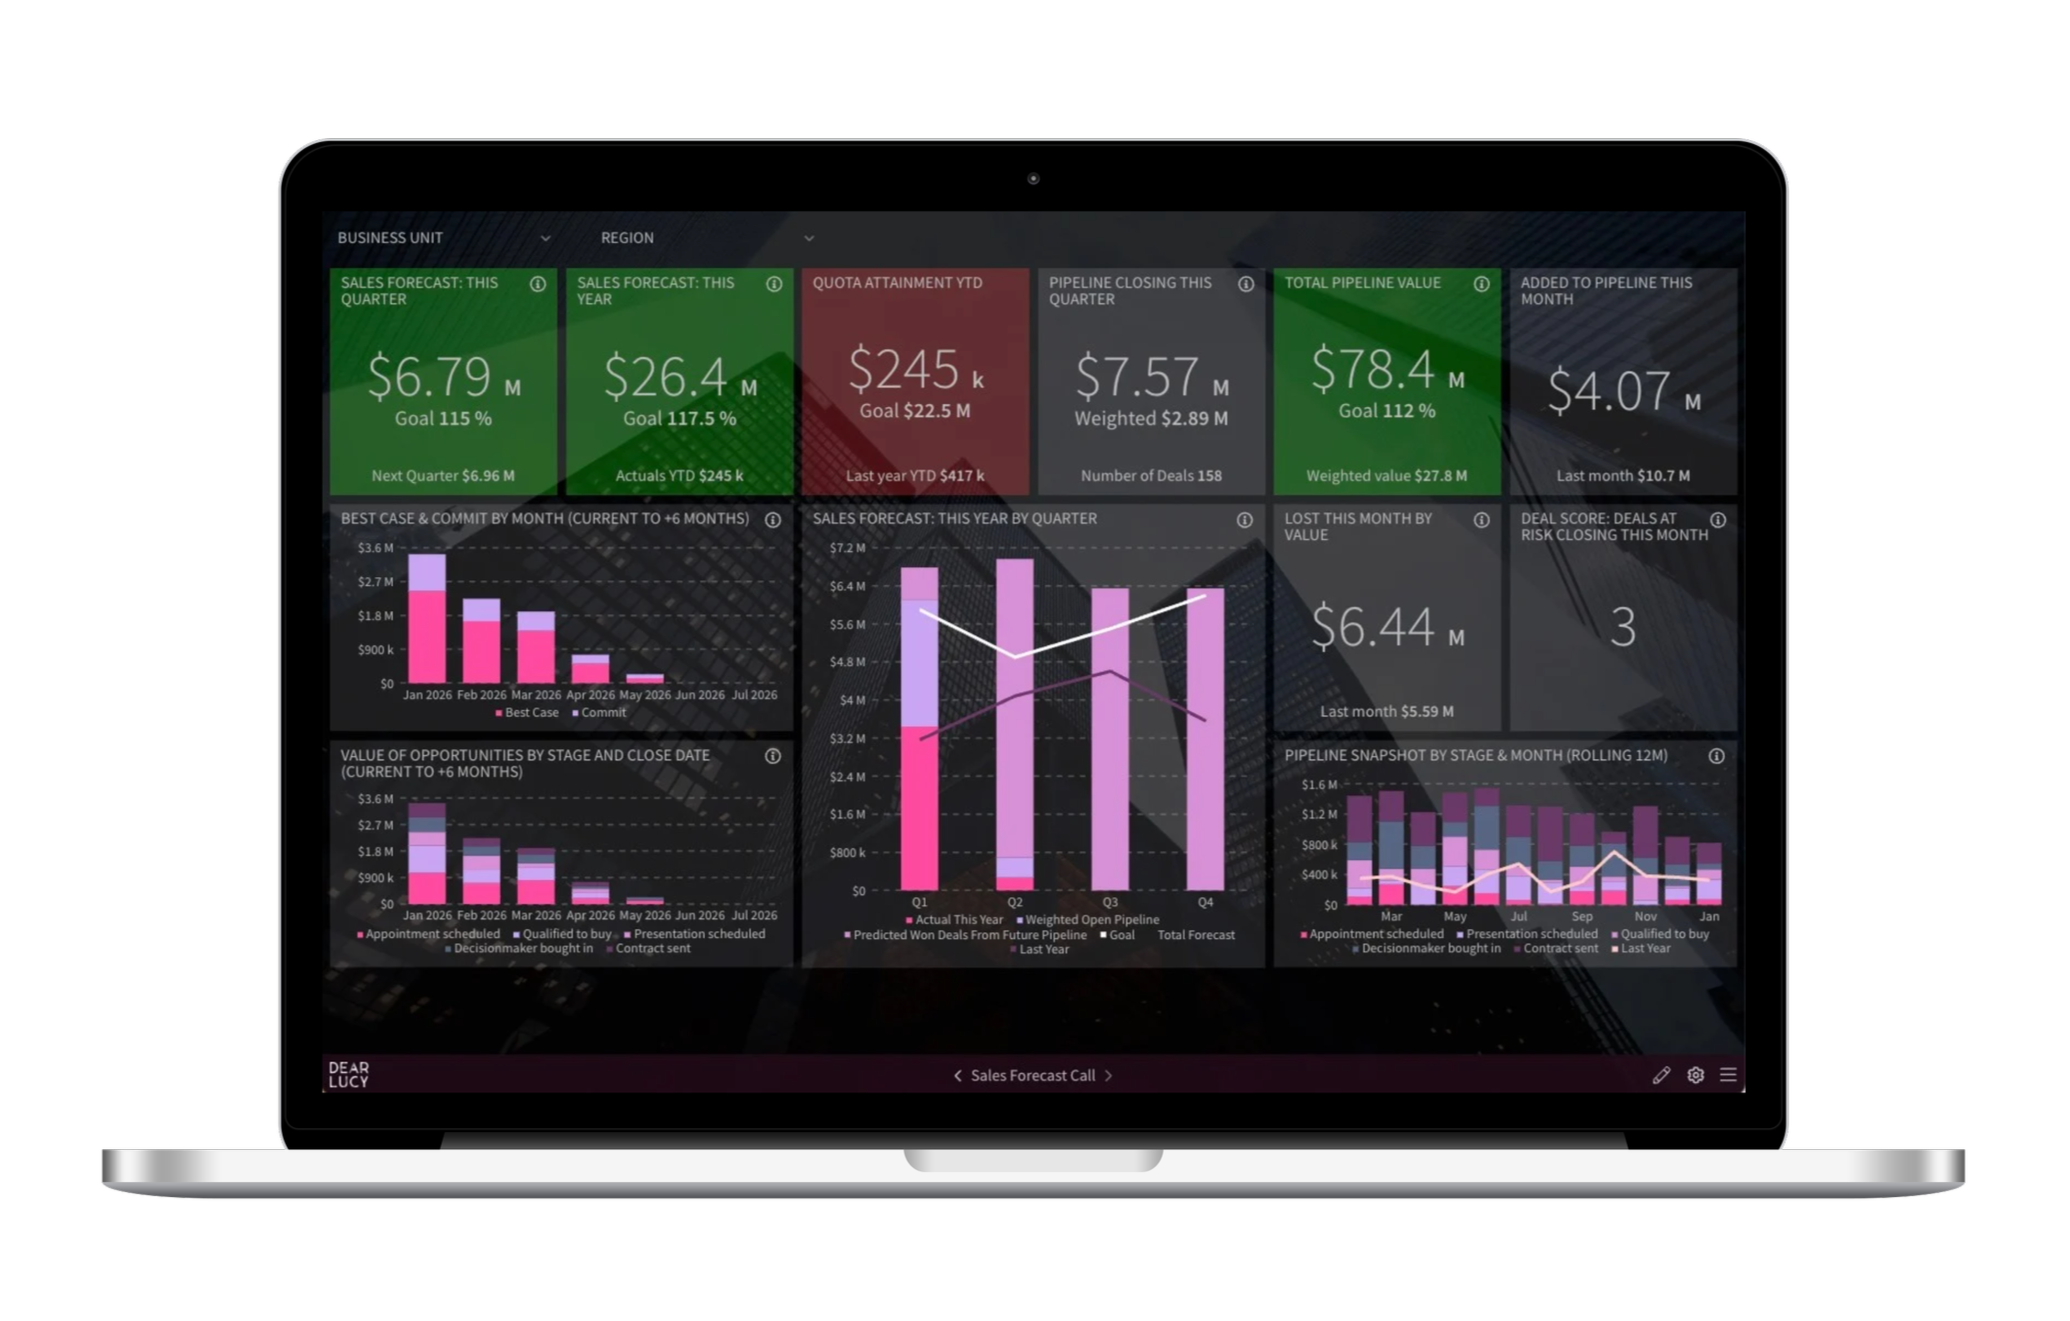
Example of a sales forecasting dashboard used in forecast calls and pipeline reviews, combining forecast vs target, commit and best case views, pipeline coverage, deal movement, and risk signals — all based on live CRM data.
Why sales teams choose Dear Lucy for forecast calls
Plug-and-play forecasting dashboards
Sales forecasting dashboards are ready out of the box — built for forecast calls and weekly pipeline reviews.
No spreadsheets.
No manual rollups.
No rebuilding reports before every call.
Data-backed forecasts — not gut feel
Forecasts are grounded in real CRM data and deal behavior, not subjective confidence.
Teams see forecast vs target, pipeline coverage, deal movement, and forecast accuracy clearly — keeping discussions factual and aligned.
Visual goal pacing for fast alignment
Forecast progress is shown visually, making it instantly clear whether teams are on track or falling behind.
This keeps pipeline reviews and forecast calls focused on decisions and actions — not explanations.
How modern sales forecast calls & pipeline reviews actually work
With sales forecasting dashboards, forecast calls and pipeline reviews typically follow this flow:
Start with forecast vs target
Review pipeline coverage and health
Focus on deal movement since the last review
Surface risk and upside early
End with clear actions and owners
This structure keeps pipeline reviews short, consistent, and outcome-driven — and forecast calls grounded in reality.
What to review in a sales forecast call & pipeline review
Effective forecast calls and pipeline reviews focus on a small set of signals that actually move the number.
Forecast vs target
A clear view of where the team is likely to land — not just what’s already closed.
Pipeline coverage
Whether there is enough pipeline to realistically hit the number — now and in the next period.
Deal movement
What moved since the last review — pushed deals, pulled deals, and new additions.
Risk and upside
Which deals could break the forecast, and where growth may accelerate.
Trend over time
How forecast accuracy and pipeline health are evolving — not just a single snapshot.
This is what turns weekly pipeline reviews into reliable forecasting.
One forecasting foundation — used across the business
Sales forecasting dashboards don’t live in isolation.
The same data and definitions are used for:
Weekly pipeline review meetings
Leadership forecast calls
This creates one shared version of the truth — from sales reps to leadership to the board.
Built on live CRM data
Dear Lucy connects directly to your CRM, so forecasts are always based on the latest data — not snapshots or exported spreadsheets.
Works seamlessly with:
Forecast calls and pipeline reviews are only as good as the data behind them — and that data is always current.
From pipeline reviews to confident reporting
Pipeline reviews shape everything that follows.
The same forecasting dashboards support:
Weekly and monthly leadership reviews
Board and investor reporting
Sales rep coaching and 1:1s
When pipeline reviews are consistent, forecasts stabilize — and trust in the numbers increases.
When sales forecasting dashboards matter most
This use case resonates strongly when:
Forecast calls feel unreliable or subjective
Pipeline reviews turn into long status meetings
Numbers change late in the quarter
Leadership wants higher forecast accuracy
Boards expect clearer explanations
If that sounds familiar, forecasting dashboards built for pipeline reviews and forecast calls are the missing foundation.
See sales forecasting dashboards in action
If you want to see how sales forecasting dashboards work with your CRM and weekly pipeline review cadence, we’re happy to show you.