Salesforce Reporting, Forecasting & Dashboards
Visual dashboards, reliable forecasting, and goal pacing — from board to reps.
One revenue view. Tailored for every role.
Salesforce dashboards for board reporting, sales leadership, and individual sellers — all powered by the same trusted revenue metrics.
Sales leadership
Track forecast, pacing, and risk across teams — without chasing updates or spreadsheets.
Board reporting
A clear, high-level view of revenue, pipeline, and forecast — always up to date.
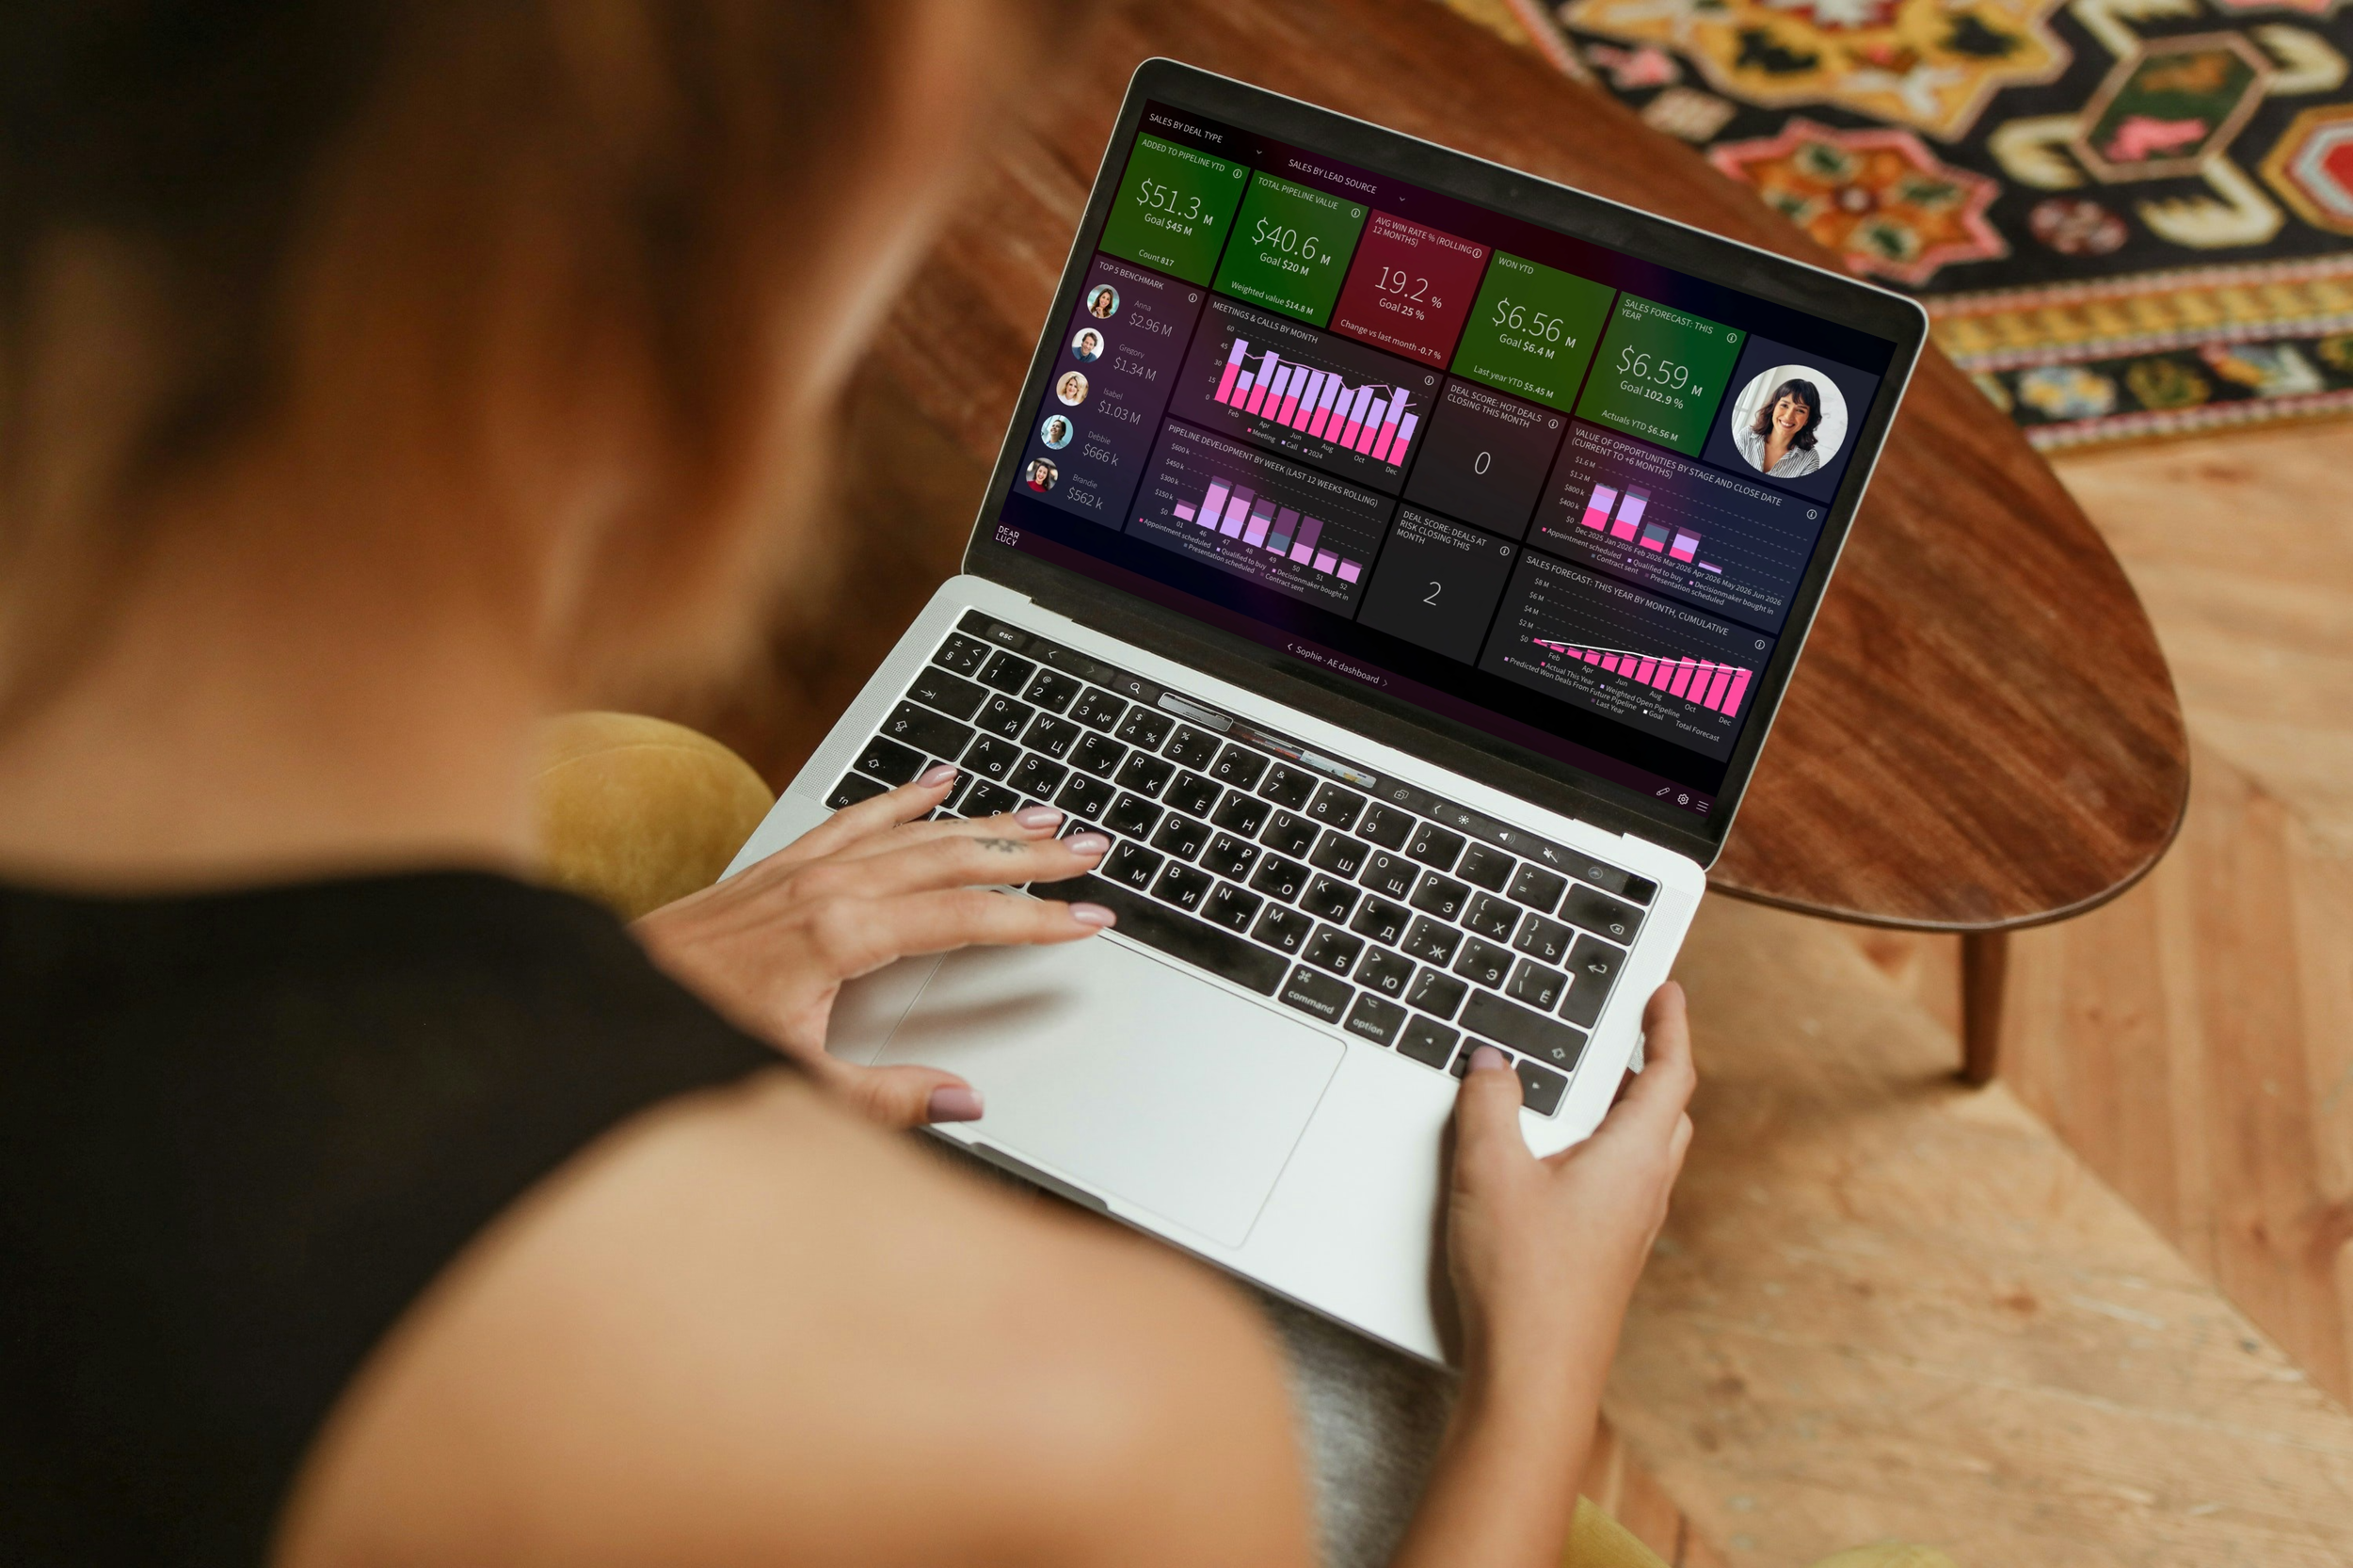
Account executives
See progress against targets, priorities, and deal health — all in one view.
Team visibility
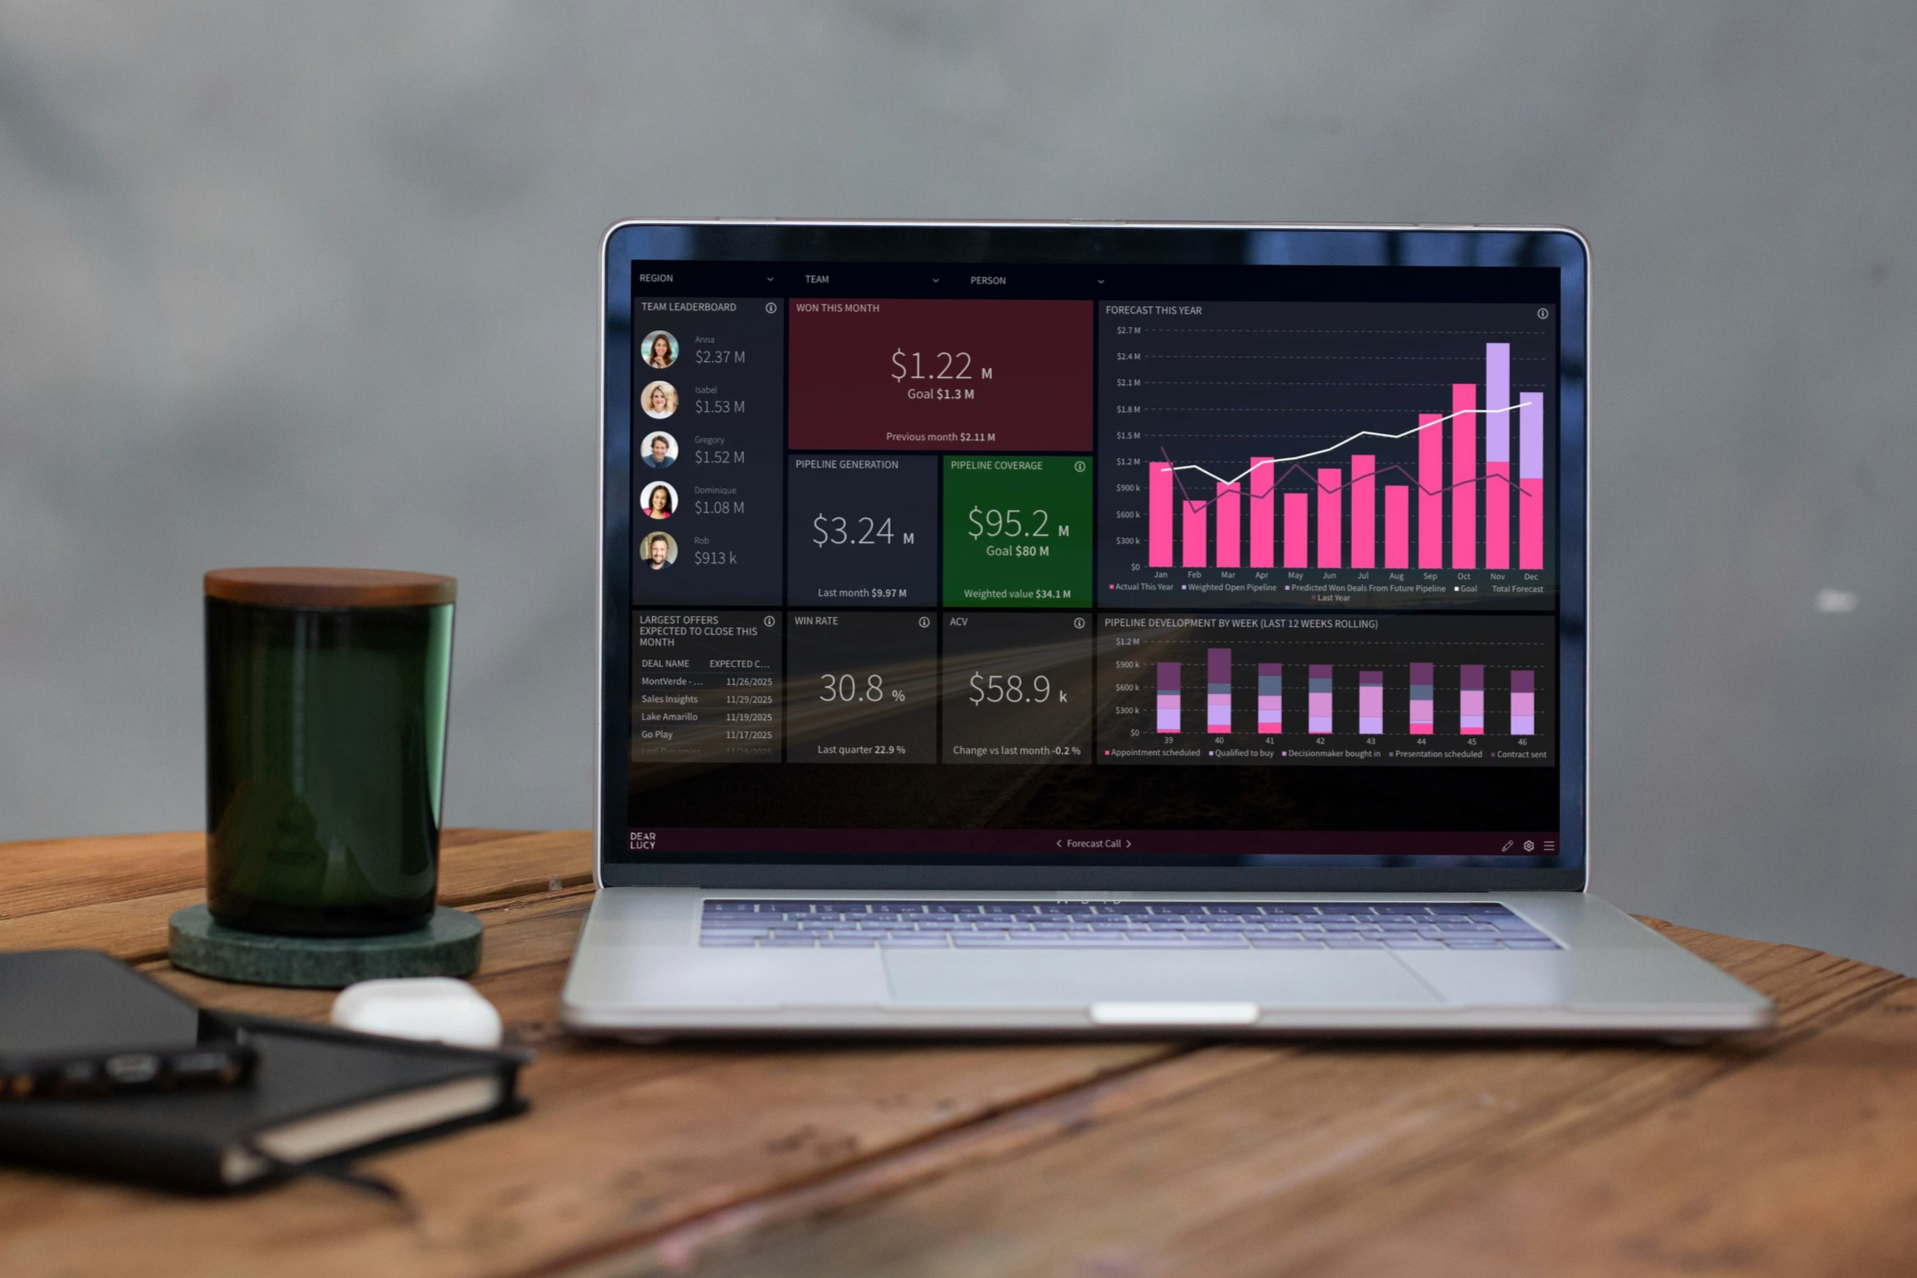
A shared revenue view for offices, forecast calls, and weekly reviews.
Revenue clarity you can act on
Connected to Salesforce. Updated automatically. Used across the company.
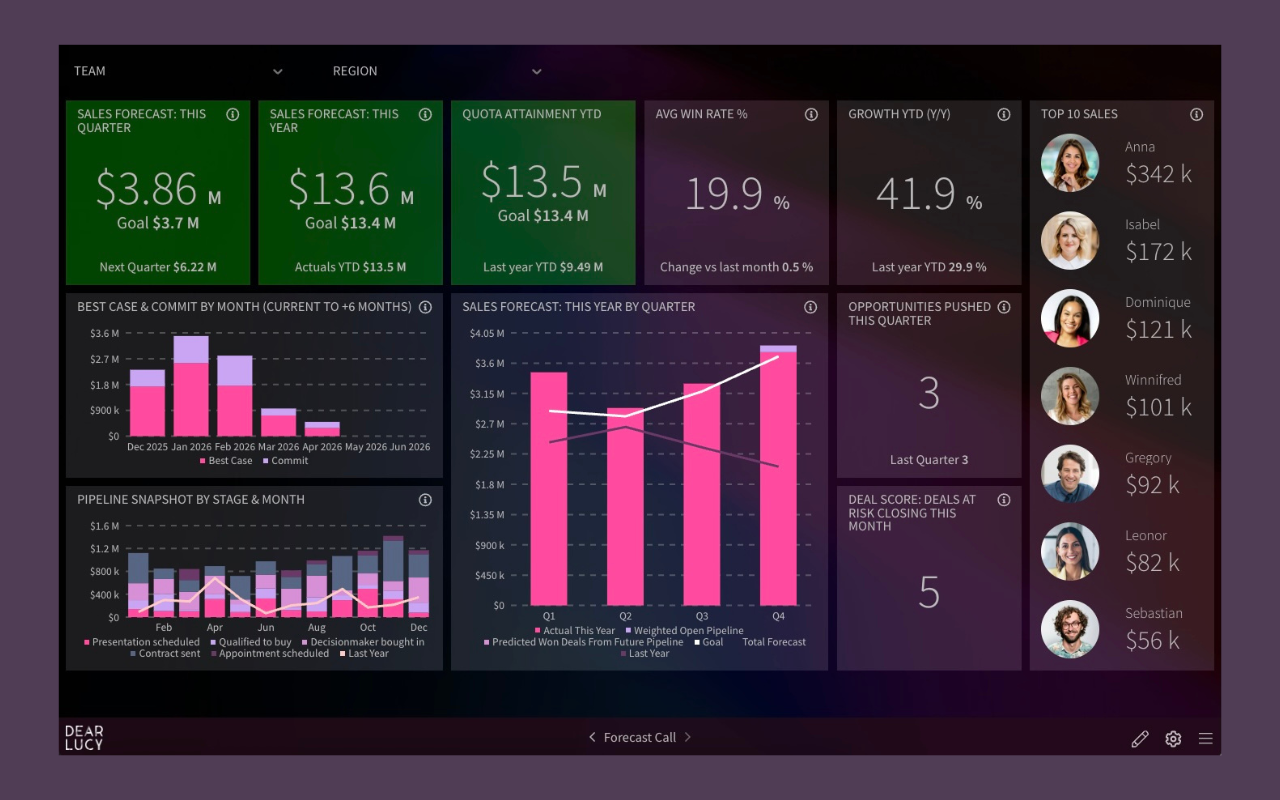
Forecasting you can trust
Forecasts based on real Salesforce pipeline behavior — not manual rollups or last-minute updates, with forecast accuracy tracked continuously.
Goal pacing that drives action
See early if teams or reps are ahead, behind, or at risk — while there’s still time to act, with clear clear on-track / off-track goal pacing.
Built for leadership visibility
A single revenue view used in forecast calls, reviews, and board meetings — always in sync.
““Dear Lucy gives us visual, transparent goal tracking at every level — company, teams, and individual reps. It keeps our revenue org aligned, focused, and moving fast toward our goals — from weekly meetings to board updates.”
”
How it works
Connect Dear Lucy to Salesforce and your dashboards appear automatically.
No custom report building. No manual updates.
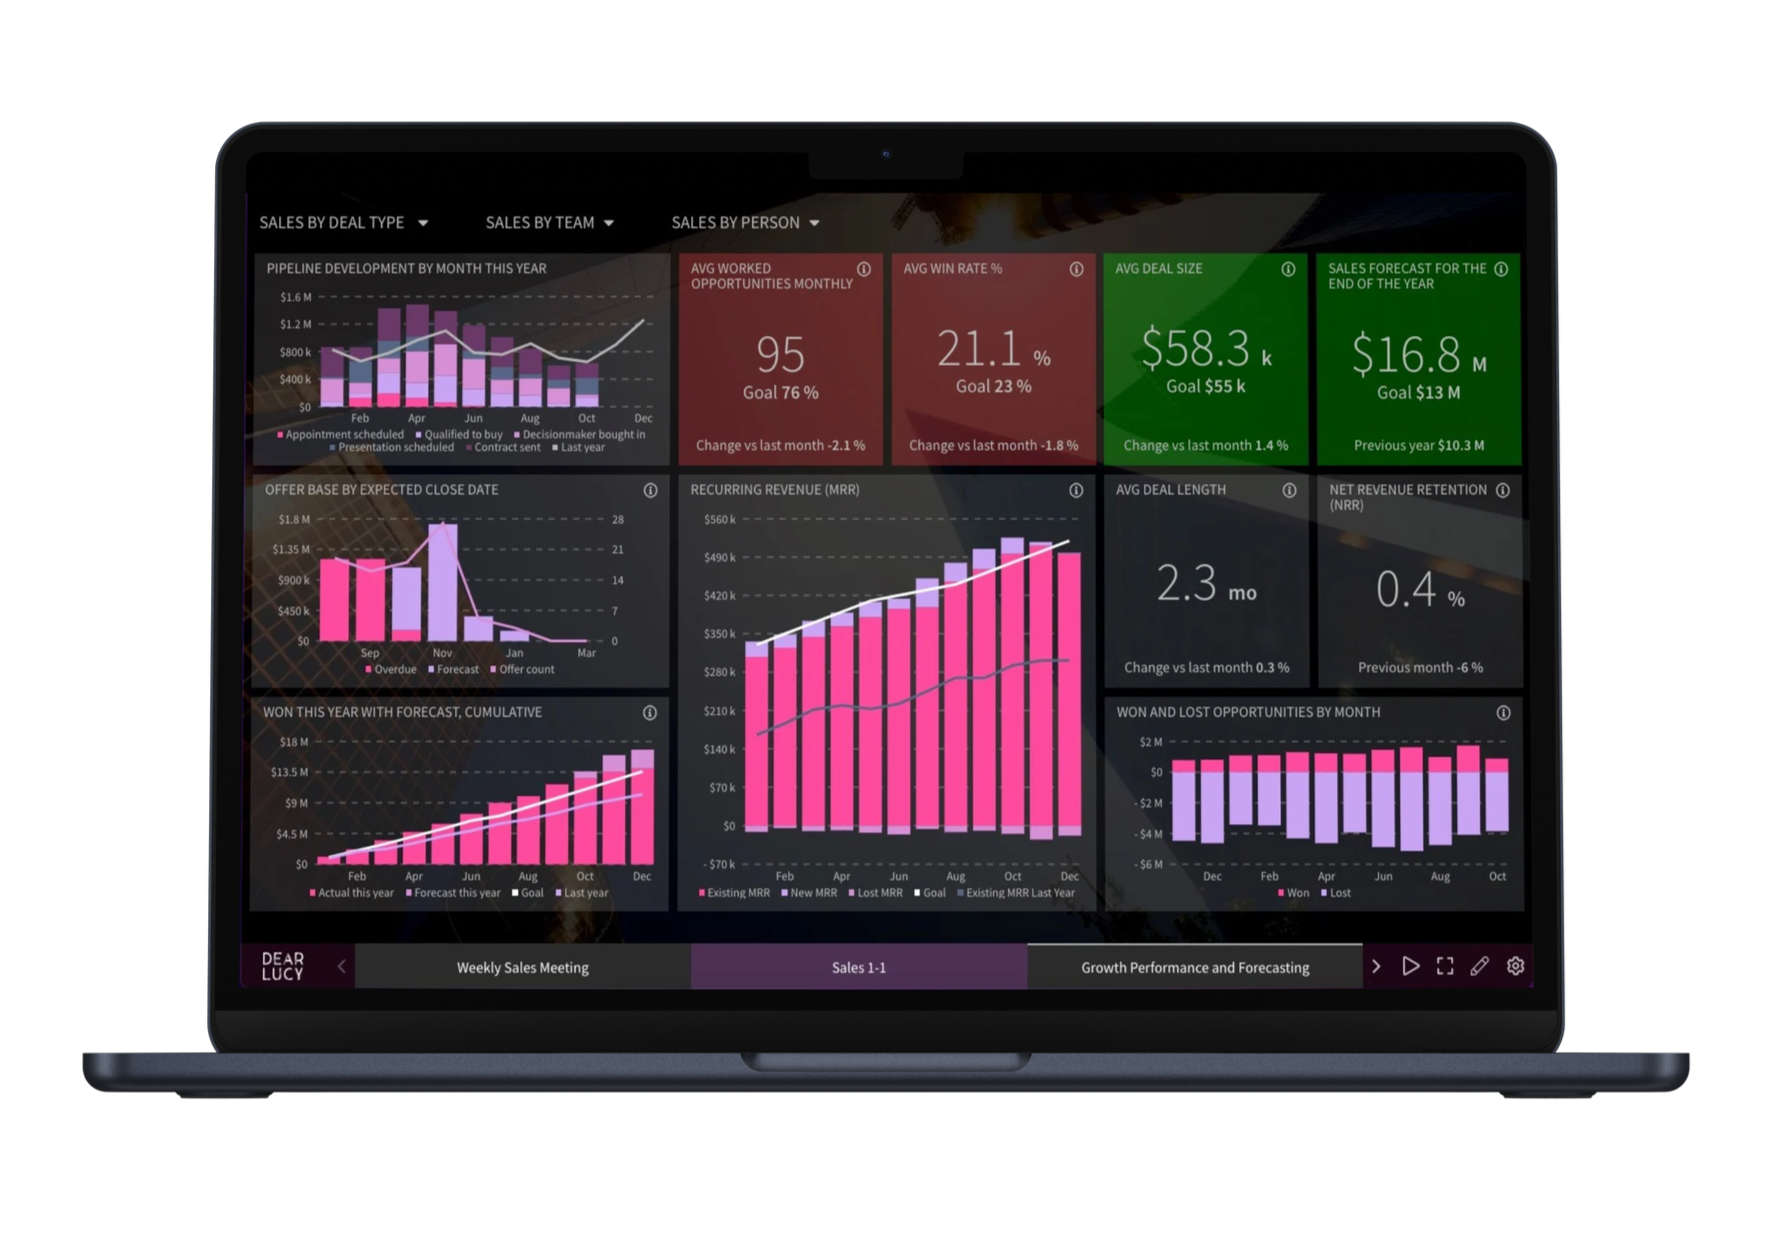
Popular Salesforce dashboards teams use every day
Ready-made dashboards built on Salesforce data — no custom reporting required.
Pipeline & Forecast Dashboard
Forecast vs target, pipeline coverage, and deal risk — always up to date.
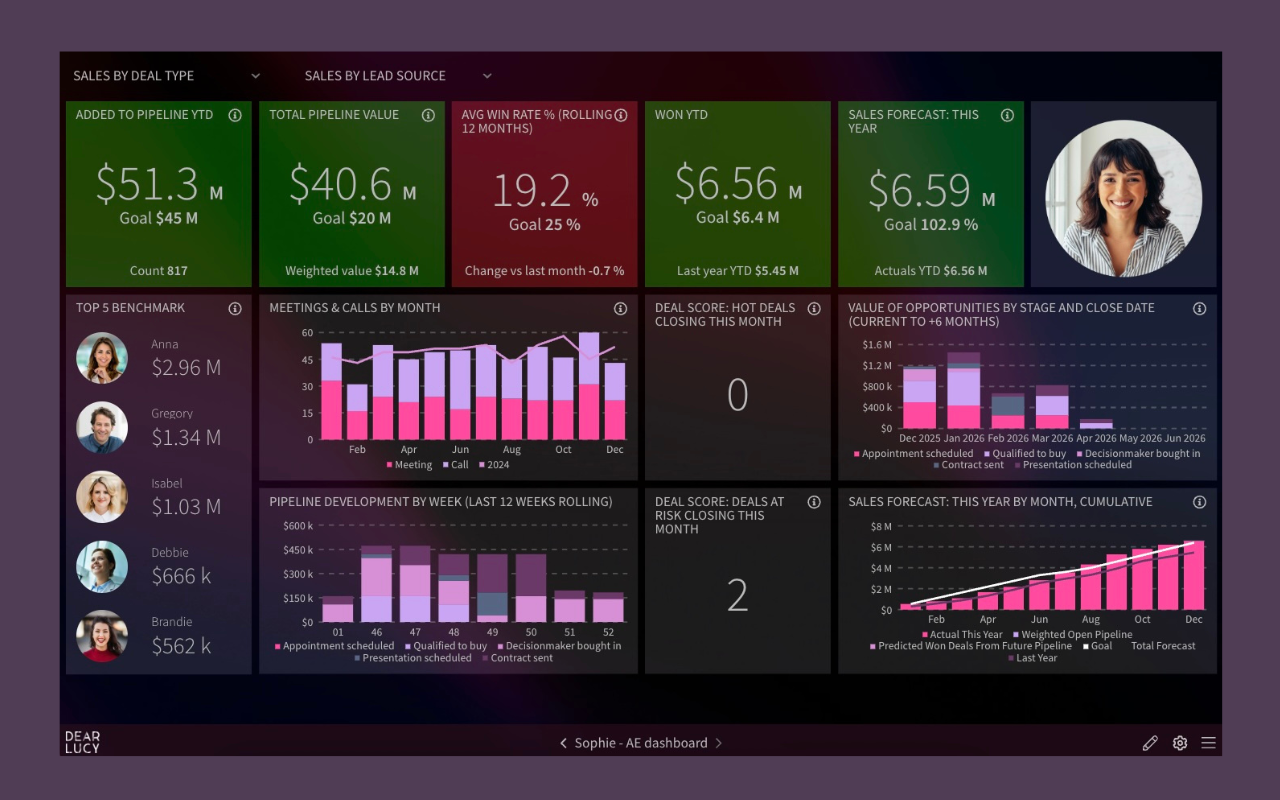
Personal Sales Dashboard
Goal pacing, pipeline, and deal progress for each rep — always visible inside Salesforce.
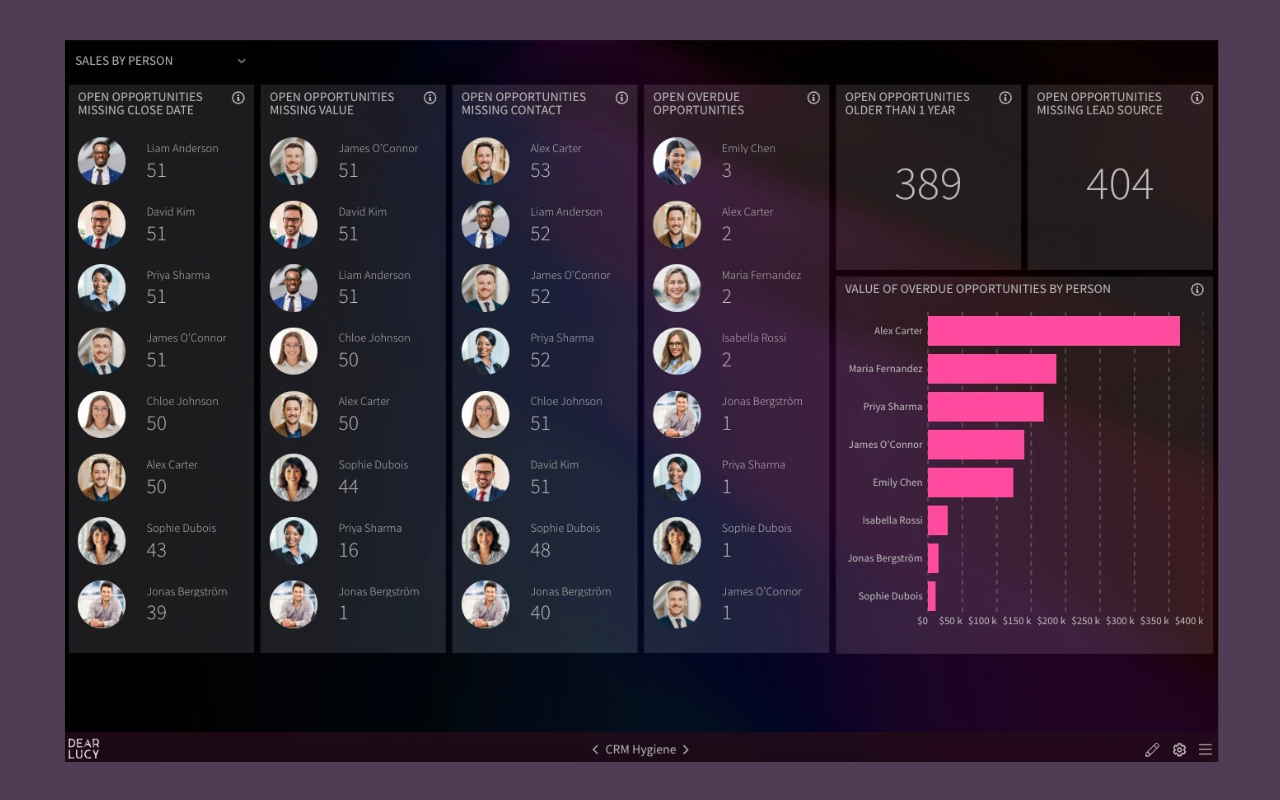
Salesforce Data Quality Dashboard
Missing fields, stalled deals, overdue activities — visible at a glance.
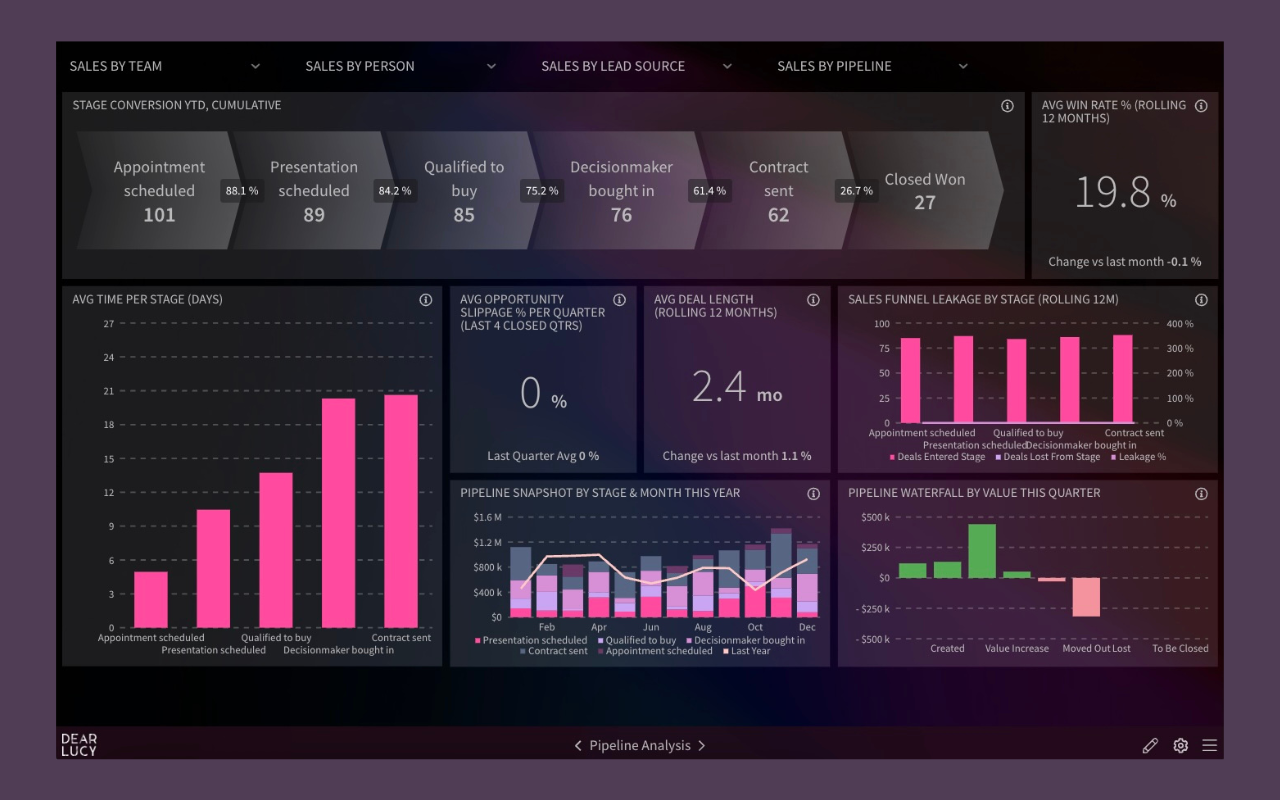
Pipeline Analytics Dashboard
Conversion rates, stage performance, and pipeline trends — all in one view.
Ready to see this with your own Salesforce data?
Connect Salesforce. Dashboards appear automatically.
FAQ
Quick answers for CROs, RevOps, and Salesforce leaders.
Is Dear Lucy a Salesforce reporting tool?
Yes. Dear Lucy is a revenue analytics layer built on Salesforce data, designed specifically for sales reporting, forecasting, and goal tracking — without heavy custom report work.
How is this different from native Salesforce dashboards?
Salesforce dashboards show data. Dear Lucy adds ready-made revenue metrics, goal pacing, forecasting logic, and role-based views — so teams can act, not just report.
Does Dear Lucy replace Salesforce?
No. Dear Lucy works on top of Salesforce, using your existing data to deliver clearer dashboards, forecasts, and leadership views.
Can sales reps and leaders use the same dashboards?
Yes. Dear Lucy provides one shared revenue view, tailored for reps, managers, and executives — all driven by the same trusted data.
How long does setup take?
Most teams connect Salesforce and start using dashboards the same day. Connect Salesforce — your dashboards appear automatically. No manual updates.
Is this built for CROs and sales leadership?
Yes. Dear Lucy is designed for forecast calls, board reporting, goal pacing, and revenue reviews — not just operational reporting.

