Why Sales Dashboards Matter in HubSpot
When it comes to sales performance, visibility drives action. And HubSpot’s dashboards can be powerful — if set up with the right logic.
From daily focus for reps to real-time pacing insights for leaders, the best dashboards do more than just report numbers. They help teams:
Track the right goals at every level
Identify pipeline gaps early
Spot CRM issues before they hurt your forecast
Make better, faster decisions
The challenge? Building a setup that works across reps, teams, and leadership — without drowning in spreadsheets.
What Sales Dashboards Do You Actually Need?
Let’s simplify. Most sales organizations need three core dashboard types in HubSpot:
1. Personal Dashboards (for reps & BDRs)
Daily focus: open deals, tasks, next actions
Activity vs outcome: meetings vs pipeline impact
Pacing: traffic lights or trend lines on weekly KPIs
2. Team Dashboards (for managers & RevOps)
Pipeline coverage and movement
Forecast vs. target with pacing alerts
CRM hygiene: overdue tasks, unworked deals, missing fields
Leaderboards to spotlight top performers
3. Company Dashboards (for leadership, finance, board)
Revenue trends (MRR/ARR, expansion, churn)
Goal tracking at rep, team, region, BU levels
Conversion funnel analytics
Forecast accuracy vs historical
These dashboards form your sales command center — and they’re all possible in HubSpot. The key is how you build them.
Track MRR with ease — access full guide here.
How to Build Dashboards in HubSpot
HubSpot gives you a flexible dashboard builder and custom report tools. Here’s what works — and what often holds teams back.
What You Can Do Natively:
Combine up to 30 reports per dashboard
Use filters, pipeline views, and rep breakdowns
Add visualizations for deal value, stage progress, and basic activity metrics
Common Challenges:
Max 100 reports per portal = limited flexibility
No pacing or traffic light alerts
No trend views (e.g. pipeline growth over time)
Hard to build multi-KPI dashboards (goals + pipeline + hygiene)
Forecasting is based only on deal stage probabilities
Building great dashboards natively in HubSpot often requires workarounds, partner help, or — for many teams — a spreadsheet backup.
How to Get These Dashboards Live with a HubSpot Dashboard Plugin
Here’s the fast track: use a HubSpot-certified dashboard plugin like Dear Lucy to get instant, embedded dashboards right inside your HubSpot CRM — no spreadsheet hacks, no custom builds.
You’ll get purpose-built dashboards for sales forecasting, recurring revenue, rep goals, and pipeline analytics — already connected to your CRM, and ready to go.
With a 1-minute setup, you get:
Personal dashboards for every rep
Team dashboards with goals, pacing, and pipeline health
Company dashboards with forecast views and conversion funnels
And it doesn’t stop there:
Predictive forecasting using historical and pipeline data
CRM hygiene insights — like the “Wall of Shame” dashboard
Dashboard support for hybrid revenue models (recurring + one-time)
Works with multiple currencies, business units, and custom KPIs
No coding, no heavy configuration — just actionable dashboards where your team already works: inside HubSpot.
Learn more about our HubSpot reporting solution →
HubSpot Dashboard Examples for Sales Teams
Here are a few dashboards top-performing teams rely on daily — all built and embedded directly from Dear Lucy.
Personal Rep Dashboard
Keep individual sellers focused and on target. See open deals, key activities, and personal goal progress in one view.

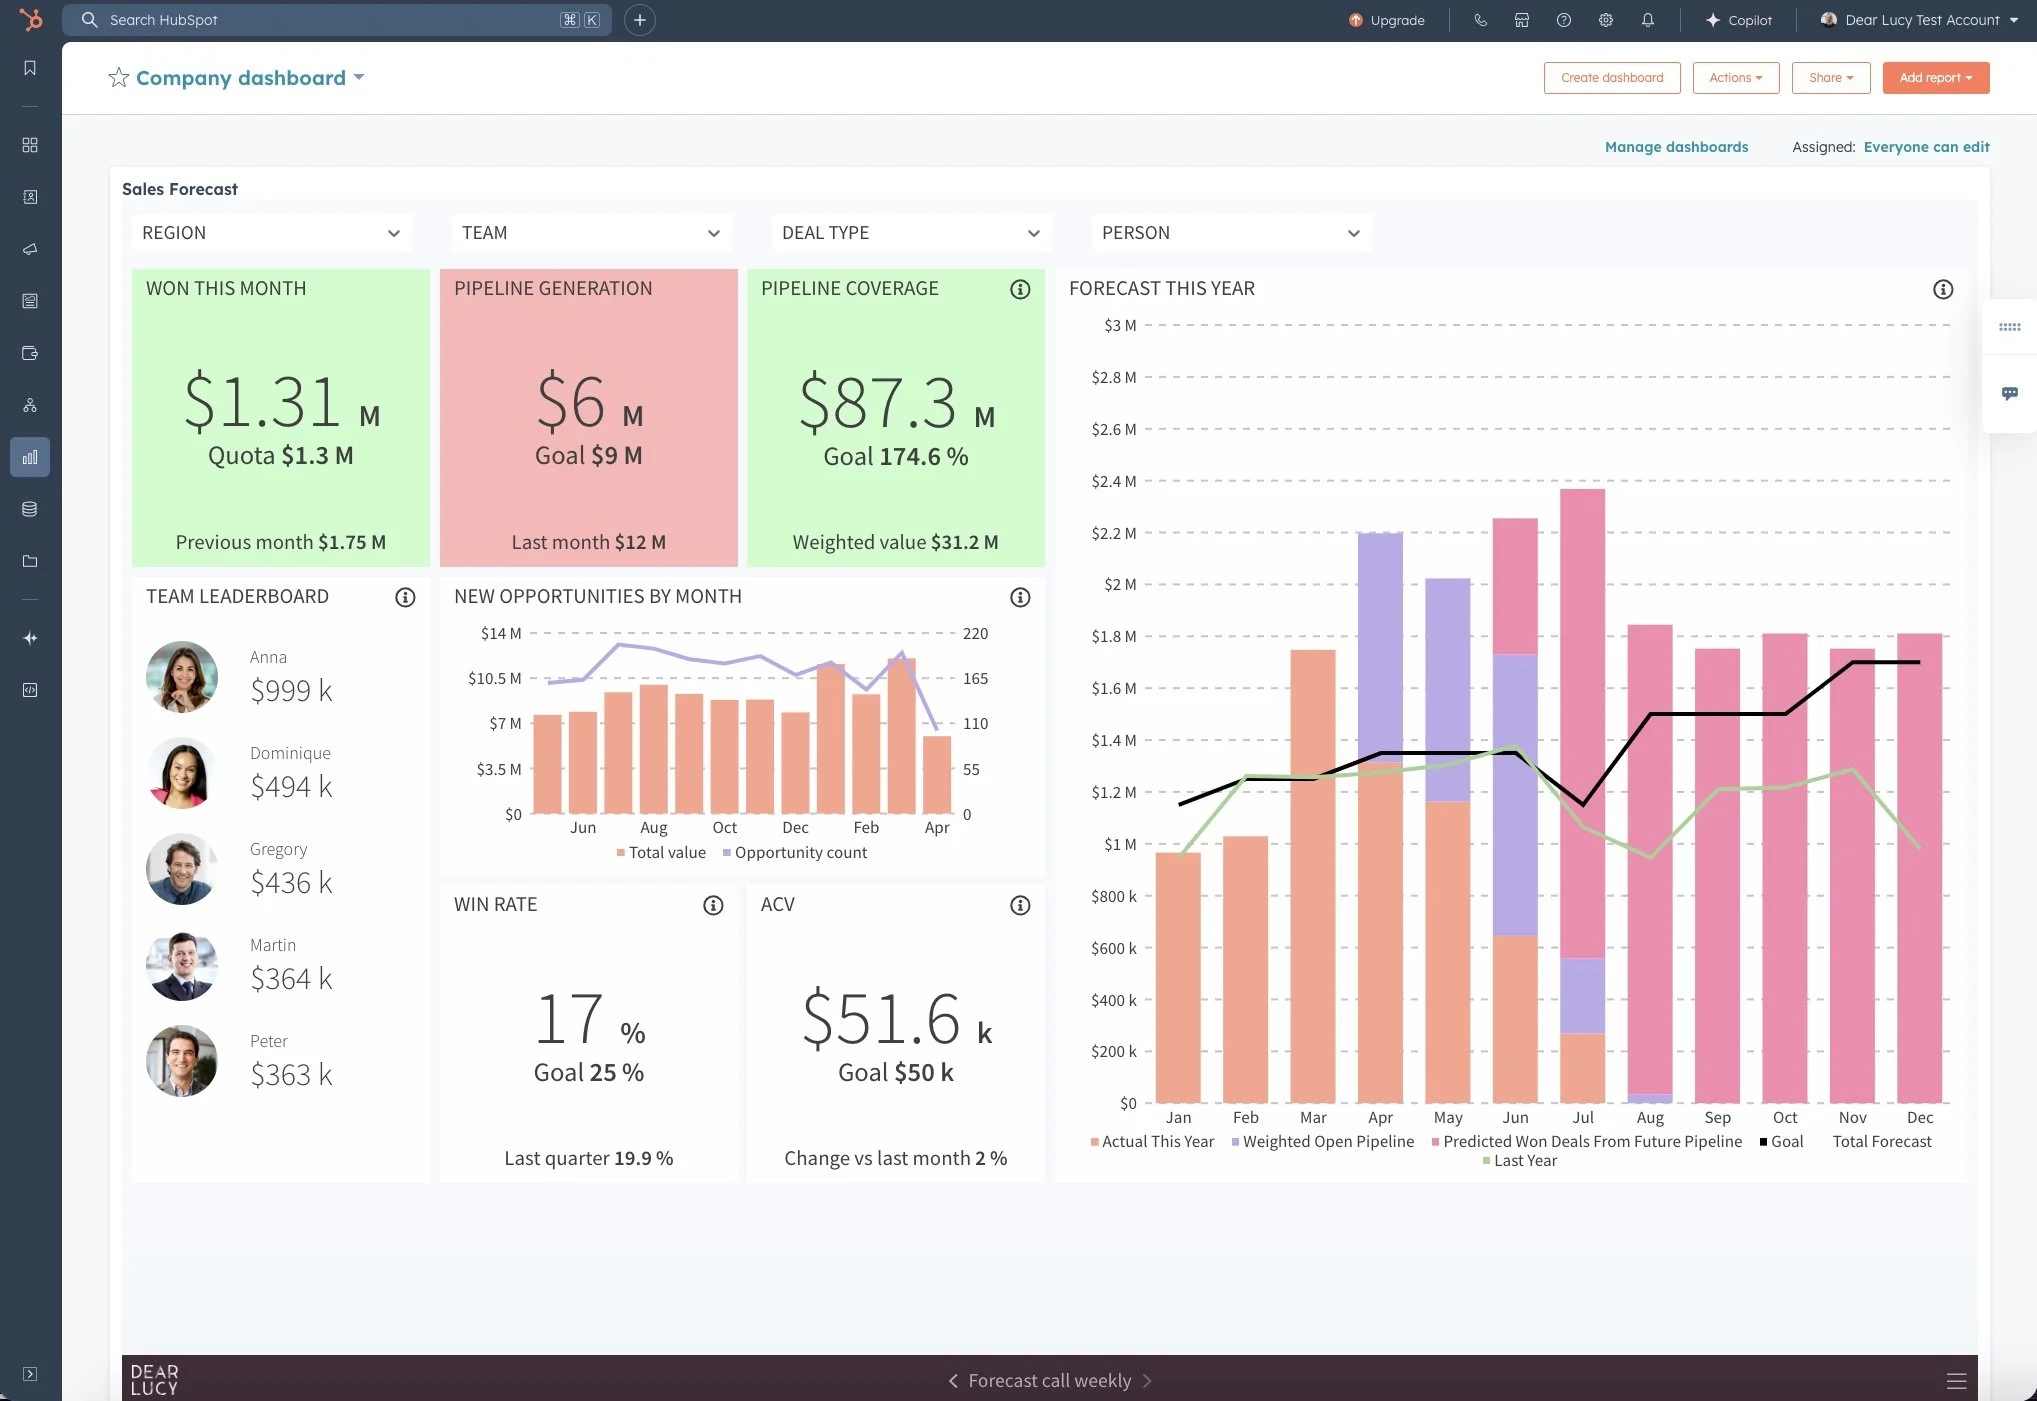
Forecast vs Target Dashboard
Visualize how your pipeline is trending toward goal. Spot risk, see pacing insights, and align your team in real time.
CRM Hygiene / Wall of Shame DASHBOARD
Highlight overdue deals, missing fields, and stalled opportunities — no micromanagement needed.
Read more about how to improve your HubSpot CRM data quality →

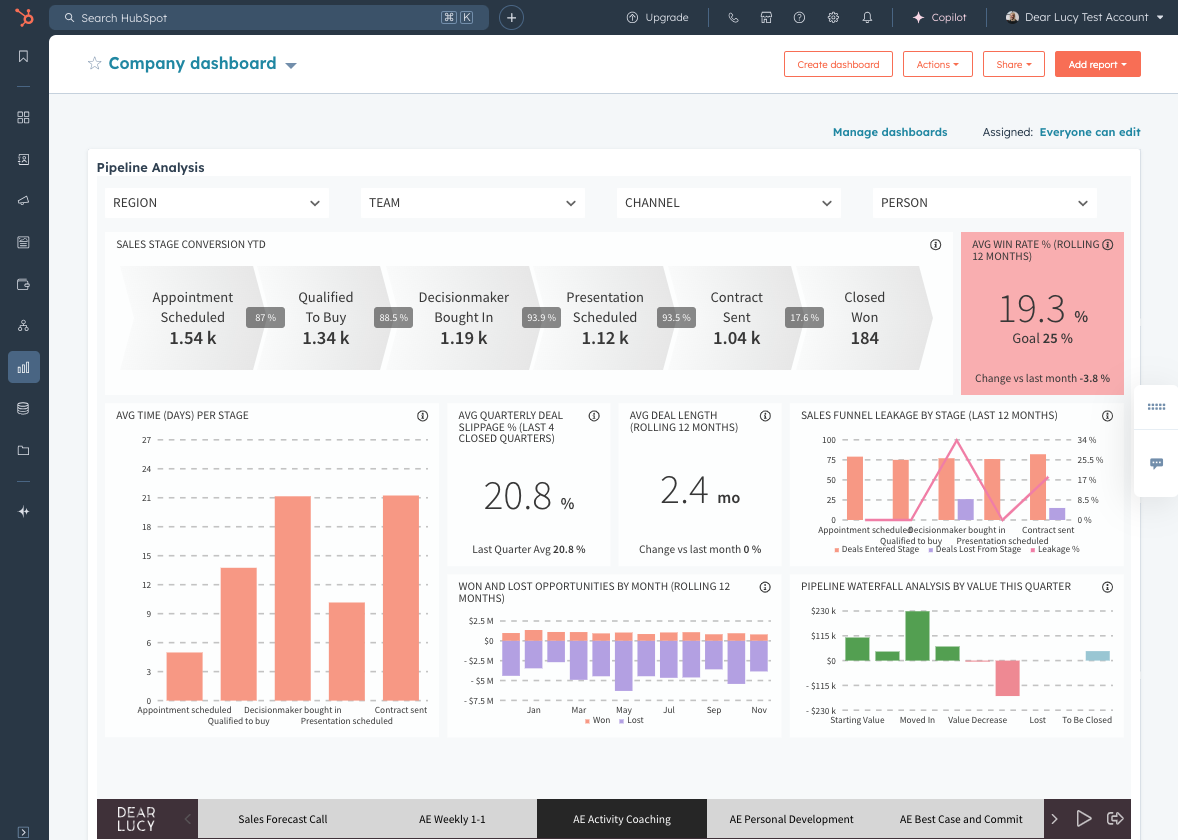
Pipeline Analytics
Understand how deals move (or stall) through your pipeline. Analyze time-in-stage, stage-by-stage conversion rates, and pipeline coverage to improve forecasting and coaching.
Read our complete HubSpot reporting guide →
How to Get Started with HubSpot Dashboards That Actually Work
Once you’ve seen what great dashboards can look like, the next step is simple. Here’s how to go from scattered metrics to shared clarity — in just a few minutes:
1. Start a HubSpot dashboard trial (powered by Dear Lucy)
No setup stress. Just connect your HubSpot account and your dashboards populate automatically.
2. Browse your new dashboards and tweak if needed
Need a slightly different KPI? Want to adjust filters or groupings? It’s all editable — and fast.
3. Share dashboards inside HubSpot (or beyond)
Drop your new dashboards directly into your HubSpot dashboard view for daily use. And if your CEO doesn’t log in to the CRM? No problem — just share access or display them on a TV screen.
Final Thoughts
A HubSpot sales dashboard shouldn’t just summarize — it should spark action.
When reps see their pacing, they adjust.
When managers see hygiene gaps, they coach.
When leadership sees trends, they act fast.
With the right setup — and the right tool — your dashboards become the sales engine your team needs.
Frequently Asked Questions (FAQ)
Can I build custom sales dashboards in HubSpot?
Yes — HubSpot’s dashboard builder lets you add custom reports for Deals, Activities, Contacts, and more. But you’re limited to 30 reports per dashboard, and advanced views (like MRR, pacing, or hygiene) require workarounds or external tools.
Can I embed dashboards into HubSpot from other tools?
Yes — with Dear Lucy, you can create dashboards and drop them directly into your HubSpot dashboard view using public links. This makes the dashboards feel native, without needing to switch tools.
What if I want to share dashboards with people outside HubSpot?
You have two options. Use public links to embed dashboards in HubSpot, display them on TV screens, or share in Slack and email — no login needed. Or, invite users to Dear Lucy, so each person logs in to view the dashboards tailored for their role.
Do I need technical help to get started?
Nope. Just connect your HubSpot account to Dear Lucy. Your dashboards are ready in minutes, and no coding or setup is required.
Can I customize what each team sees?
Yes — Dear Lucy supports user groups, so Sales Reps, Managers, Executives, or Board Members each get dashboards tailored to them.
TL;DR
HubSpot dashboards are powerful — but setting them up for sales performance takes time and finesse. This guide walks you through:
Which dashboards you actually need — personal, team, company-wide
What’s possible natively in HubSpot (and where you’ll hit limits)
How to create dashboards with predictive forecasting, pacing, and pipeline insights
How to go live fast with dashboards embedded in your HubSpot CRM
About Dear Lucy
Dear Lucy is a HubSpot Certified App that turns your CRM data into powerful, real-time dashboards for sales teams. From forecasting and recurring revenue to goal tracking and CRM hygiene, Dear Lucy helps you drive better decisions — fast.
Plug-and-play setup. No spreadsheets. No complex tools. Just the dashboards you need, exactly where you work.