
Revenue forecasting sounds simple until you try to operationalize it.
Salesforce already contains opportunities, products, Revenue Schedules, Product Schedules, and forecasting data. Yet many RevOps and Salesforce teams still find themselves maintaining revenue forecasts in spreadsheets.
Why?
Because leadership isn't asking for a list of opportunities.
They're asking:
Are we on track?
What's the revenue gap?
Which regions are behind?
How much revenue is already secured?
What changed since last week's forecast?
Those questions require more than a standard forecast report.
TL;DR
Salesforce already contains much of the data needed for revenue forecasting, including opportunities, Revenue Schedules, Product Schedules, and custom fields. The challenge is turning that data into visibility. Leading Salesforce teams automate revenue forecasting by combining forecasted revenue, targets, pacing, and forecast-vs-actual reporting into a single view.
The Typical Salesforce Revenue Forecasting Journey
Most teams start in Salesforce.
Then someone asks for:
Revenue by month
Revenue by business unit
Revenue by region
Revenue by product
Revenue vs target
Forecast vs actual
Then someone asks for board reporting.
Then someone asks for pacing.
Then someone asks for forecasting based on Revenue Schedules rather than opportunity amount.
That's usually the moment the spreadsheet appears.
Not because Salesforce lacks the data.
Because the business is asking more sophisticated questions.
Why Revenue Schedules Matter
For organizations selling subscriptions, services, projects, maintenance contracts, or multi-year agreements, opportunity value is only part of the picture.
The revenue forecast often lives inside:
Revenue Schedules
Product Schedules
Subscription data
Custom Salesforce objects
Salesforce does a great job storing this information.
The challenge is making it visible in a way that helps leadership make decisions.
A CRO doesn't want to know where the data lives.
They want to know:
Are we on pace?
Will we hit the quarter?
Which teams are behind?
Where should we focus?
A Common Example
Imagine a company selling multi-year software contracts.
Revenue Schedules already exist in Salesforce, but leadership wants to understand:
Forecasted revenue next quarter
Revenue versus target
Revenue pacing
Forecast versus actual performance
The data exists. The challenge is bringing it together in a format that helps teams make decisions.
What Automated Revenue Forecasting Looks Like
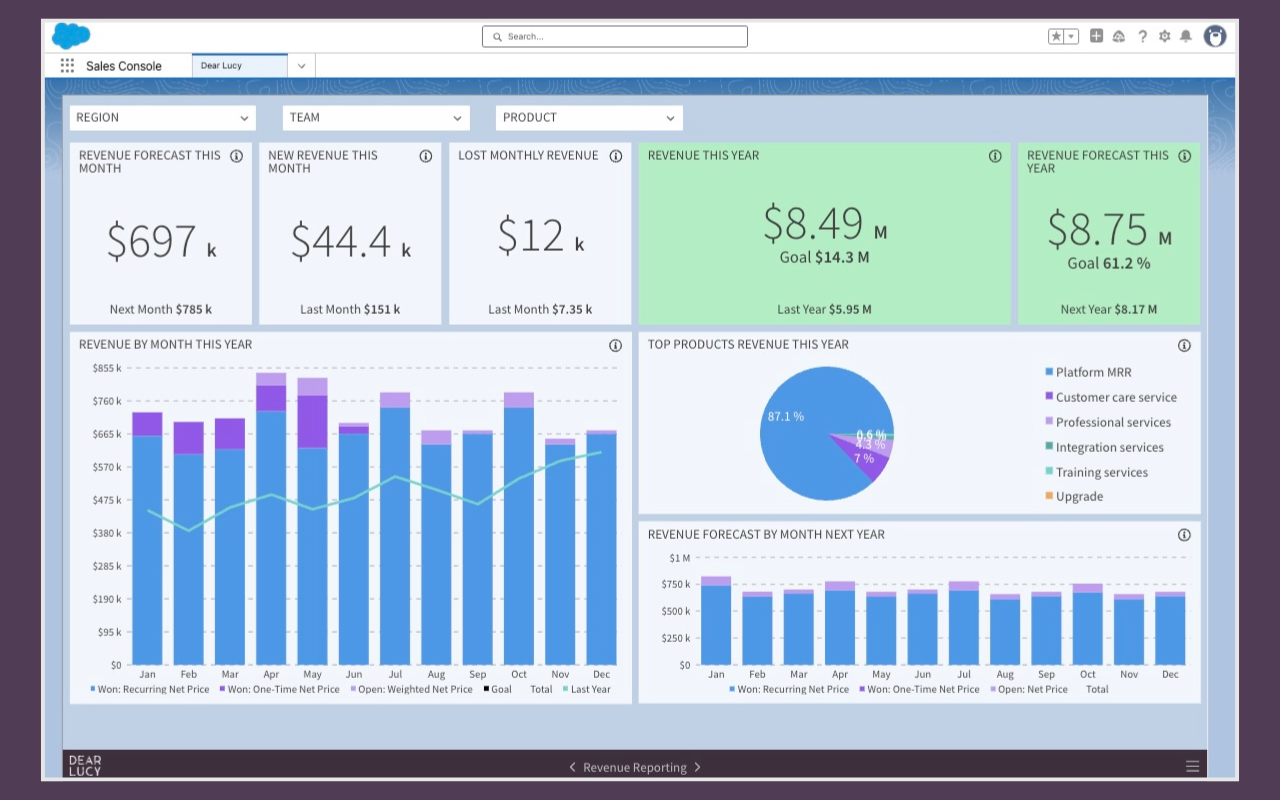
Example: Revenue forecasting dashboard built on Salesforce opportunities, Revenue Schedules, targets, and actual revenue.
The most mature Salesforce teams automate:
Revenue forecasts
Revenue targets
Revenue pacing
Forecast vs actual reporting
Revenue by segment
Executive dashboards
Instead of manually updating spreadsheets every week, forecasts update automatically as Salesforce data changes.
This creates a shared view for sales leadership, RevOps, finance, and management.
Everyone works from the same numbers.
Everyone understands the same forecast.
Common Revenue Forecasting Use Cases
Revenue Forecast vs Target
Can we still hit the quarter?
This is often the first question leadership asks.
Seeing forecasted revenue alongside targets makes it immediately obvious whether additional pipeline, activity, or deal progression is required.
Revenue Pacing
Are we moving fast enough?
Revenue pacing helps teams understand whether current performance is sufficient to reach monthly, quarterly, or annual goals.
For a deeper dive into tracking progress against targets, see our guide to Salesforce goal pacing.
Revenue by Business Unit
Which business units are outperforming?
As organizations grow, leaders need visibility beyond company-level totals.
Revenue by Region
Which markets need attention?
Revenue forecasting becomes much more useful when it can be segmented by geography, vertical, or territory.
Forecast vs Actual
How accurate are our forecasts?
Comparing forecasted revenue against actual results helps teams continuously improve forecasting accuracy.
Revenue forecasting is only one side of the equation. Teams also need accurate historical revenue reporting. Learn how to track ARR, MRR, and subscription revenue in Salesforce.
Board Reporting
Can leadership access the same numbers as the revenue team?
Board reporting often becomes significantly easier when forecasts, targets, and actuals are available from a single source.
Why RevOps Teams End Up Owning Revenue Forecasting
Revenue forecasting usually starts as a sales problem. Before teams can forecast revenue accurately, they need a reliable pipeline forecasting process. If you're evaluating different forecasting approaches, read our guide to Salesforce Forecasting.
Over time, it becomes a business problem.
Sales needs visibility.
Finance needs confidence.
Leadership needs predictability.
RevOps often becomes responsible for connecting all three.
The best RevOps teams don't spend their time maintaining spreadsheets.
They build repeatable forecasting processes that automatically transform Salesforce data into actionable insights.
That allows forecast reviews to focus on decisions instead of debating numbers.
How Salesforce Teams Automate Revenue Forecasting
The most successful Salesforce teams typically build a reporting layer on top of the Salesforce data they already have.
This allows them to combine:
Opportunities
Products
Revenue Schedules
Product Schedules
Custom Salesforce fields
Revenue targets
into a single forecasting view.
The result is visibility into:
Forecasted revenue
Revenue targets
Revenue pacing
Forecast vs actual
Revenue by team
Revenue by region
Revenue by product
Revenue by business unit
without manually rebuilding reports every week.
How Dear Lucy Helps
Dear Lucy helps Salesforce teams automate revenue forecasting using the Salesforce data they already have. As a dedicated Salesforce reporting tool, Dear Lucy combines revenue forecasts, targets, pacing, and executive dashboards into one view.
Using opportunities, products, Revenue Schedules, Product Schedules, custom fields, and targets, teams can create dashboards for:
Revenue forecasting
Revenue pacing
Revenue targets
Forecast vs actual
Revenue by segment
Executive reporting
Because Dear Lucy supports custom Salesforce fields, forecasts can be segmented based on your own business structure rather than being limited to standard Salesforce dimensions.
The goal isn't to replace Salesforce.
The goal is to help revenue teams get more value from the Salesforce data they already trust.
Final Thoughts
Most organizations already have the data required for revenue forecasting.
The challenge is turning that data into something leadership can act on.
The Salesforce teams that do this well don't spend their time updating spreadsheets.
They automate revenue forecasts, connect them to targets, and make them visible across the business.
That's when forecasting stops being a reporting exercise and starts becoming a management tool.
And ultimately, that's what every CRO, RevOps leader, Salesforce admin, and sales manager wants:
Not more data.
A clearer view of whether the business is on track.
Frequently Asked Questions
Can Salesforce automate revenue forecasting?
Salesforce stores the data required for revenue forecasting, including opportunities, Revenue Schedules, Product Schedules, and custom fields. Many organizations add reporting and dashboarding layers to automate revenue forecasting across teams and business units.
What are Salesforce Revenue Schedules?
Salesforce Revenue Schedules allow revenue to be distributed across future periods and are commonly used by organizations selling subscriptions, services, and multi-year agreements.
What is the difference between pipeline forecasting and revenue forecasting?
Pipeline forecasting focuses on opportunity value and expected deal outcomes. Revenue forecasting focuses on when revenue is expected to land and whether it aligns with targets.
How do RevOps teams forecast revenue in Salesforce?
Most RevOps teams combine Salesforce opportunities, Revenue Schedules, targets, and performance dashboards to create a shared revenue forecast across sales, finance, and leadership.
Can Salesforce forecast revenue by month?
Yes. Monthly revenue forecasting is commonly built using Revenue Schedules, Product Schedules, custom objects, or reporting layers connected to Salesforce.