

Sales Pipeline Analysis
Sales pipeline analysis helps sales leaders understand how opportunities move through the sales funnel, where deals slow down, and why forecasts change.
Instead of relying on intuition, Dear Lucy transforms live CRM data into pipeline analysis dashboards that reveal bottlenecks, pipeline leakage, stage conversion and sales velocity.
Identify problems earlier, improve pipeline health and make better sales decisions.
Sales Pipeline Analysis Dashboard
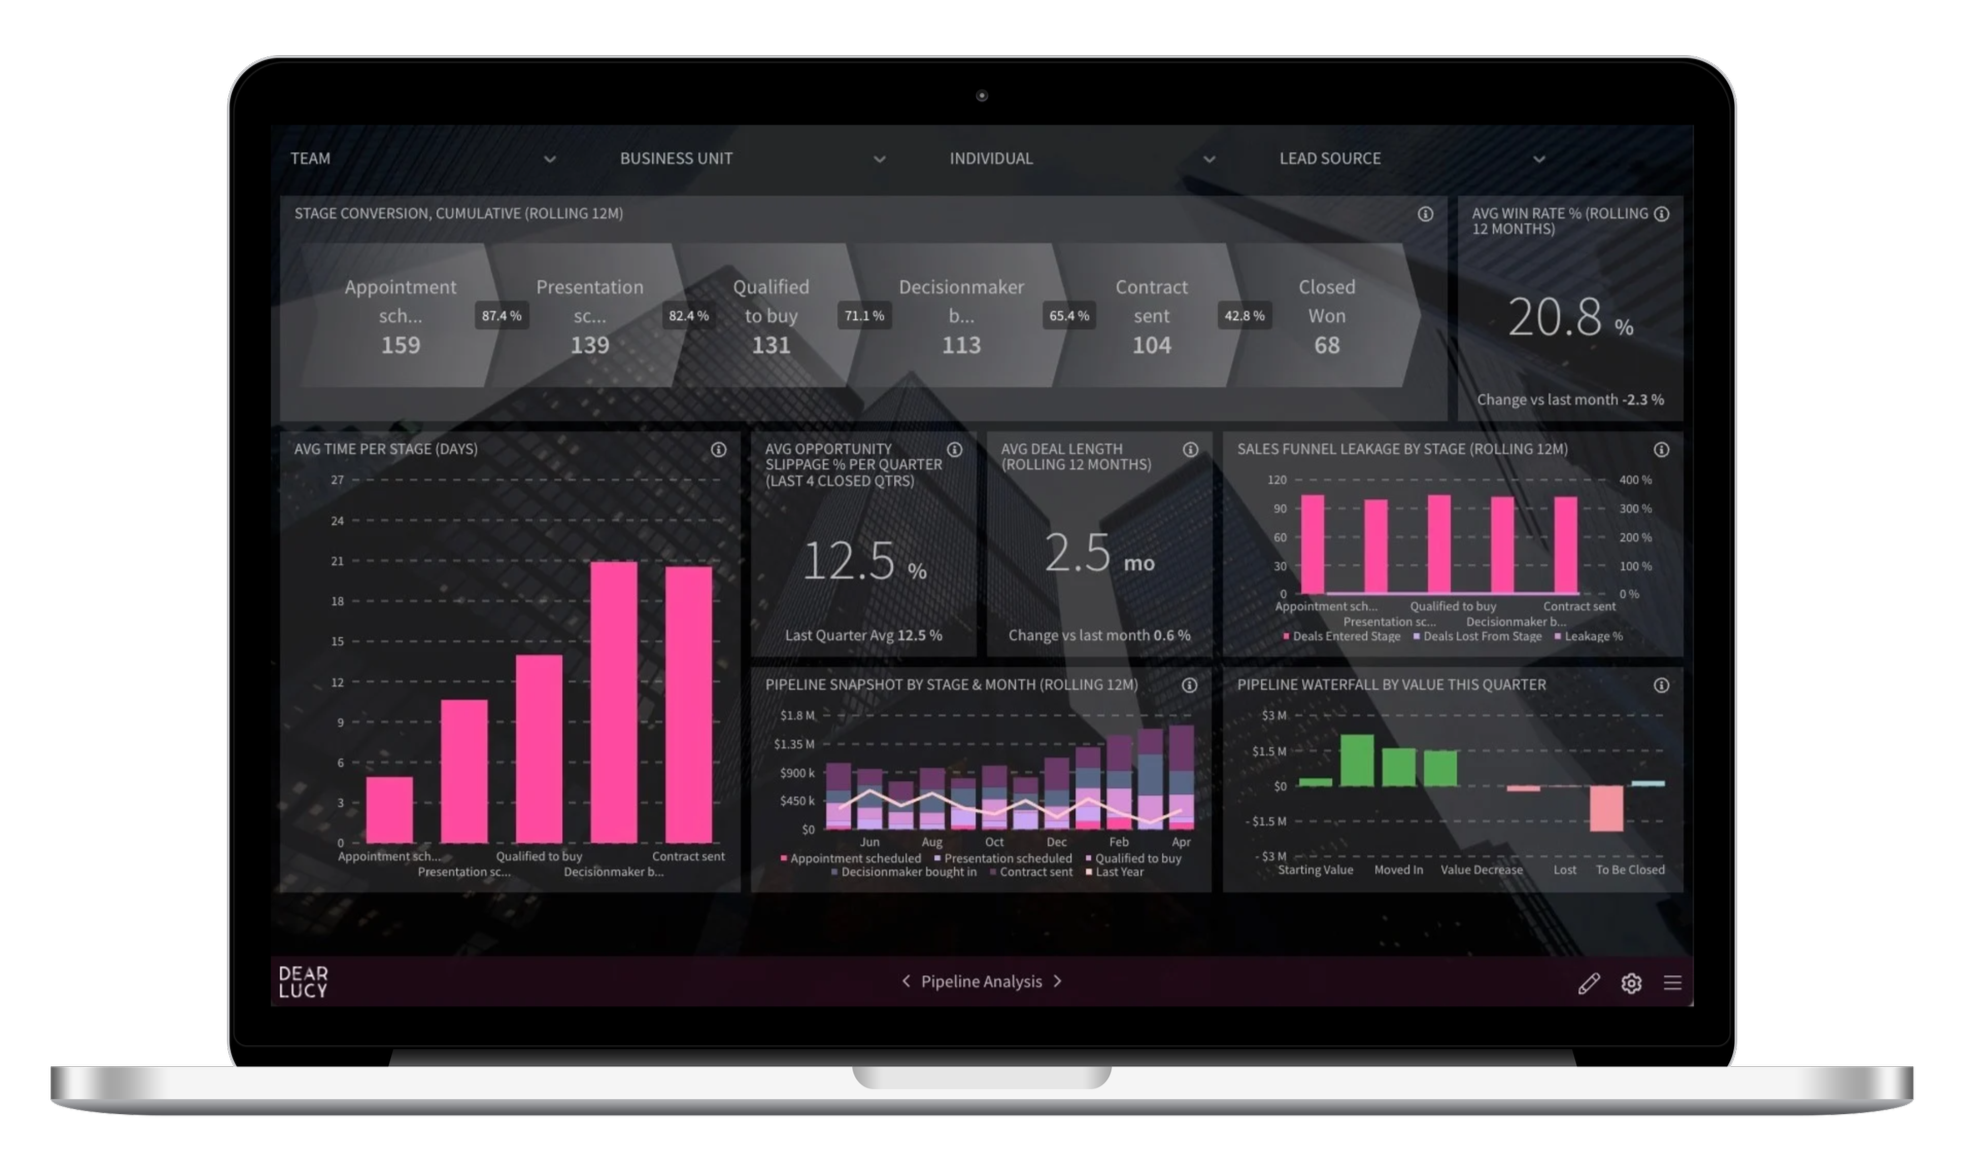
Sales pipeline analysis dashboard helping sales leaders identify bottlenecks, monitor pipeline health, improve stage conversion and understand where opportunities are slowing down or leaking from the sales funnel.
Why sales teams use pipeline analysis
Understand pipeline health
Pipeline analysis goes beyond pipeline value.
Dear Lucy helps sales teams understand how opportunities move through every stage of the sales process, revealing where deals progress, stall or disappear.
Identify bottlenecks early
See exactly where deals slow down.
Track stage conversion, average time per stage and opportunity slippage to identify bottlenecks before they impact sales performance.
Improve pipeline quality
Healthy pipelines create reliable forecasts.
Monitor pipeline leakage, deal movement and win rates to improve pipeline quality and support more predictable sales outcomes.
What to analyse in your sales pipeline
Effective pipeline analysis focuses on the metrics that drive revenue.
Stage conversion
Understand how opportunities move between each sales stage and identify where conversion rates begin to decline.
Pipeline leakage
Reveal where deals are consistently lost throughout the sales funnel.
Win rate
Track how efficiently opportunities become customers.
Deal velocity
Measure how quickly opportunities move through the pipeline and identify unnecessary delays.
Average time per stage
Understand where sales cycles slow down and where improvements will have the biggest impact.
Pipeline snapshots
Compare today's pipeline with previous periods to understand how pipeline quality changes over time.
Turn pipeline analysis into better forecasts
Healthy pipelines create better forecasts.
Pipeline analysis helps sales leaders understand why forecasts change by revealing trends in pipeline quality, conversion rates and deal movement.
The same live CRM data supports both Sales Forecasting and Revenue Forecasting, giving leadership confidence in every forecast discussion.
Built on live CRM data
Dear Lucy connects directly to your CRM, ensuring pipeline analysis always reflects the latest sales activity.
Works seamlessly with:
No exports.
No spreadsheets.
No manual reporting.
When pipeline analysis matters most
Pipeline analysis becomes essential when:
Forecast accuracy starts declining
Deals remain too long in the same stage
Pipeline coverage looks healthy but targets are still missed
Sales cycles become longer
Managers struggle to explain forecast changes
Leadership needs better visibility into pipeline health
FAQ
What is sales pipeline analysis?
Sales pipeline analysis evaluates how opportunities move through the sales process to identify bottlenecks, conversion trends, pipeline leakage and overall pipeline health. It helps sales leaders understand why forecasts change and where improvements are needed.
What metrics should a sales pipeline dashboard include?
A sales pipeline dashboard should include:
Stage conversion
Pipeline leakage
Win rate
Average time per stage
Sales velocity
Pipeline snapshots
Opportunity slippage
These metrics help sales teams monitor pipeline health and improve sales performance.
How often should sales pipeline analysis be reviewed?
Most sales organizations review pipeline analysis weekly as part of pipeline review meetings. Leadership teams often monitor pipeline health continuously using live dashboards so risks are identified before forecast calls.
What is pipeline leakage?
Pipeline leakage measures where opportunities are consistently lost as they move through the sales funnel. Identifying leakage helps sales teams improve conversion rates and forecast reliability.
How is pipeline analysis different from sales forecasting?
Pipeline analysis explains why pipeline performance changes by analysing conversion, leakage and sales velocity.
Sales Forecasting predicts whether sales targets are likely to be achieved.
Which CRM systems does Dear Lucy support?
Dear Lucy connects directly to Salesforce, HubSpot, Microsoft Dynamics 365 and Pipedrive, automatically keeping pipeline analysis dashboards up to date with live CRM data.
Can pipeline analysis improve forecast accuracy?
Yes. Understanding pipeline health, stage conversion and deal movement helps sales teams identify risks earlier, improving both forecast accuracy and confidence in sales forecasts.
See your sales pipeline more clearly
Understand where deals slow down, where opportunities are lost and how pipeline health impacts your forecasts.