
If you're a CRO, CEO, VP of Sales, or RevOps leader, you're probably tracking dozens of sales metrics.
Pipeline value.
Win rate.
Average deal size.
Sales cycle length.
Forecast accuracy.
Quota attainment.
The challenge is that these metrics often live in separate reports, making it difficult to understand how efficiently your revenue engine is actually performing.
That's where sales velocity comes in.
Sales velocity combines the key drivers of revenue growth into a single metric that helps revenue leaders understand how quickly opportunities move through the pipeline and turn into closed revenue.
More importantly, sales velocity helps answer a question every CRO cares about:
Why are some sales teams growing faster than others?
What Is Sales Velocity?
Sales velocity measures how quickly your sales organization generates revenue from opportunities in your pipeline.
It combines four critical sales performance metrics:
Number of opportunities
Win rate
Average deal size
Sales cycle length
The sales velocity formula is:
Sales Velocity = (Number of Opportunities × Win Rate × Average Deal Size) ÷ Sales Cycle Length
The result is a single metric that shows how efficiently your sales team converts pipeline into revenue.
Higher sales velocity generally means faster revenue growth.
Lower sales velocity often signals that one or more parts of your sales process need attention.
Why Sales Velocity Matters
Most sales leaders focus heavily on pipeline value.
But pipeline alone doesn't tell the whole story.
Consider two companies with a $10 million pipeline.
Company A closes deals quickly, wins a high percentage of opportunities, and maintains healthy deal sizes.
Company B has a similar pipeline value but suffers from low conversion rates and long sales cycles.
Despite having identical pipeline values, Company A will generate revenue much faster.
Sales velocity reveals this difference immediately.
It provides a more complete picture of sales performance than pipeline size alone.
The Four Levers of Revenue Growth
One reason sales velocity is so useful is that it breaks revenue growth into four actionable components.
1. Opportunity Volume
The first lever is the number of active opportunities entering your sales process.
More qualified opportunities create more potential revenue.
However, simply increasing pipeline volume isn't enough if the other levers are weak.
Questions CROs should ask:
Is pipeline growth keeping pace with revenue targets?
Are enough opportunities entering the funnel?
Which regions or teams are generating the strongest pipeline?
2. Win Rate
Win rate measures how effectively your team converts opportunities into customers.
Even small improvements in win rate can have a significant impact on sales velocity.
Questions CROs should ask:
Which teams have the highest conversion rates?
Are win rates improving or declining?
Which stages create the biggest bottlenecks?
3. Average Deal Size
Larger deals increase revenue generation without requiring additional opportunities.
Questions CROs should ask:
Is average deal size increasing over time?
Which customer segments produce larger deals?
Are upsell and cross-sell programs working?
4. Sales Cycle Length
Sales cycle length measures how long it takes to convert an opportunity into revenue.
The shorter the cycle, the faster revenue is generated.
Questions CROs should ask:
Are deals stalling in specific stages?
Which teams close deals fastest?
How much revenue is delayed by slow-moving opportunities?
How CROs Use Sales Velocity
The most successful revenue leaders don't treat sales velocity as just another KPI.
They use it as an operational tool for managing growth.
Detect Revenue Problems Earlier
Revenue is a lagging indicator.
By the time revenue declines, the underlying problem often started months earlier.
Sales velocity acts as a leading indicator.
A decline in sales velocity can reveal emerging issues before they appear in revenue reports.
For example:
Win rates may be declining.
Sales cycles may be increasing.
Deal sizes may be shrinking.
Identifying these trends early gives leadership teams time to respond.
Identify the Real Growth Constraint
When growth slows, many organizations assume they need more pipeline.
In reality, the problem may be elsewhere.
Sales velocity helps pinpoint the true constraint.
Is the issue:
Not enough opportunities?
Lower conversion rates?
Smaller deal sizes?
Longer sales cycles?
Instead of guessing, revenue leaders can focus improvement efforts where they will have the greatest impact.
Improve Forecast Reviews
Many forecast meetings focus heavily on individual deals.
While important, deal-by-deal discussions rarely reveal broader performance trends.
Sales velocity adds a strategic layer to forecasting conversations.
Instead of asking:
"Will this deal close?"
Revenue leaders can ask:
"What is happening to our sales velocity?"
This shifts forecast reviews toward operational drivers and creates more productive discussions.
Compare Teams, Regions and Sales Reps
Sales velocity is particularly useful for comparing performance across teams.
Two sales teams may generate similar revenue while operating very differently.
One may rely on large deal sizes.
Another may compensate with exceptional win rates.
Sales velocity helps reveal these differences and identify best practices that can be replicated across the organization.
Evaluate Revenue Initiatives
Every CRO is constantly evaluating new initiatives.
Examples include:
New sales methodologies
Territory changes
Additional headcount
Pricing updates
Predictive deal scoring
Sales coaching programs
Sales velocity provides a simple way to measure whether these initiatives are improving overall sales efficiency.
Common Sales Velocity Mistakes
Focusing Only on Pipeline Volume
Pipeline growth alone does not guarantee revenue growth.
Without healthy win rates, deal sizes, and sales cycles, larger pipelines often create false confidence.
Looking at Sales Velocity Too Infrequently
Quarterly reviews are not enough.
High-performing teams monitor sales velocity continuously and look for trends over time.
Ignoring Team-Level Variations
Company-wide averages can hide important performance differences.
Always analyze sales velocity by region, team, segment, and salesperson.
Treating Sales Velocity as a Standalone Metric
Sales velocity is most valuable when paired with dashboards that reveal the underlying drivers behind the number.
How Modern Revenue Teams Track Sales Velocity
Many CRM systems provide pieces of the information required to calculate sales velocity.
However, revenue leaders often need multiple reports to understand what is actually happening.
Modern sales performance management platforms combine:
Opportunities
Win rates
Average deal sizes
Sales cycle metrics
Forecasting
Goal tracking
into a single view.
This makes it easier to understand not just what sales velocity is today, but why it is changing.
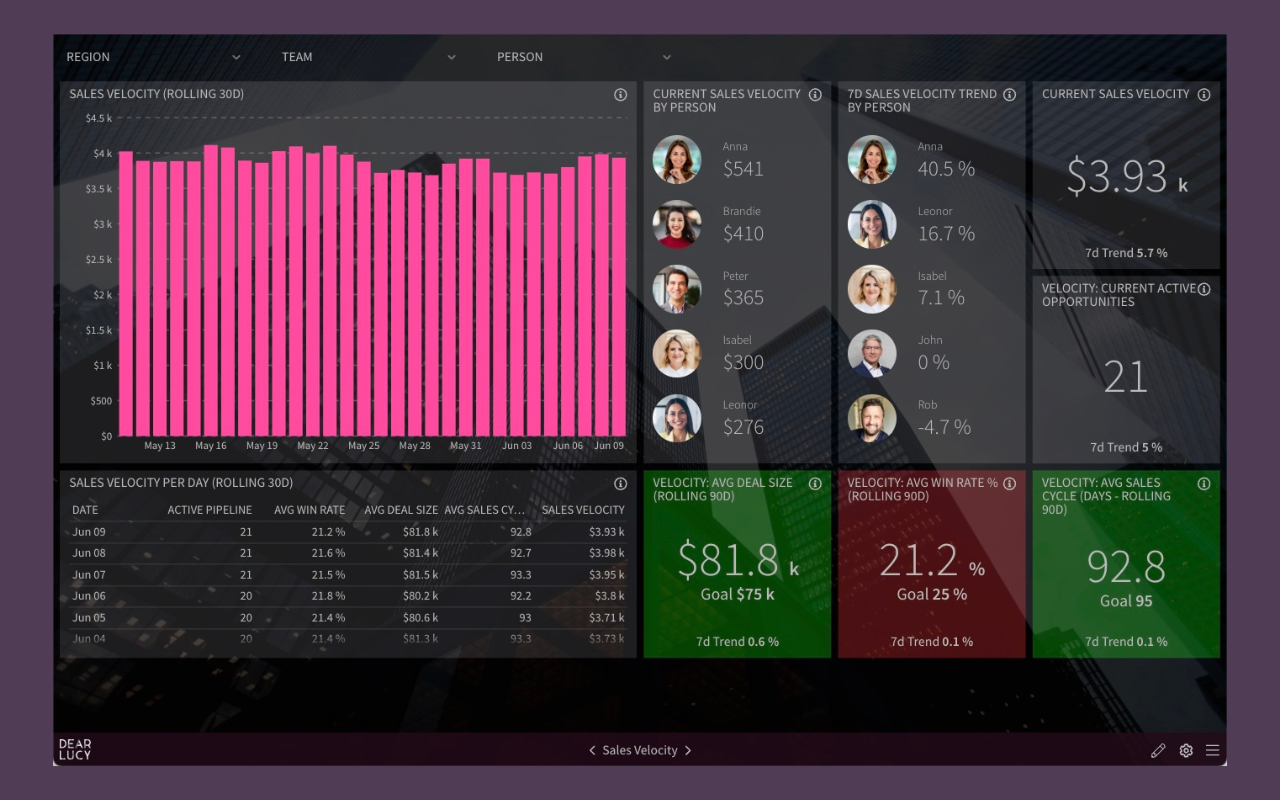
A dedicated sales velocity dashboard can help CROs identify trends, compare teams, monitor progress toward targets, and make more informed decisions about revenue growth.
Final Thoughts
Sales velocity is more than a formula.
It's a framework for understanding how efficiently your sales organization converts opportunities into revenue.
For CROs, it provides a practical way to connect pipeline generation, conversion performance, deal size, and sales execution into a single growth metric.
When monitored consistently, sales velocity helps revenue leaders identify problems earlier, improve forecasts, optimize sales performance, and accelerate revenue growth.
If you're looking for one metric that explains why some sales teams grow faster than others, sales velocity is one of the best places to start.
TL;DR
Sales velocity measures how quickly your sales organization converts opportunities into revenue.
It combines opportunity volume, win rate, average deal size, and sales cycle length into a single metric.
CROs use sales velocity to identify growth bottlenecks and improve forecasting.
Improving any of the four revenue levers increases sales velocity.
Sales velocity is often a leading indicator of future revenue growth.
Frequently Asked Questions
What is sales velocity?
Sales velocity measures how quickly opportunities move through your pipeline and generate revenue. It combines opportunity volume, win rate, average deal size, and sales cycle length into a single metric.
How do you calculate sales velocity?
Sales velocity is calculated using the following formula:
Sales Velocity = (Opportunities × Win Rate × Average Deal Size) ÷ Sales Cycle Length
Why is sales velocity important?
Sales velocity helps revenue leaders understand how efficiently their sales organization converts pipeline into revenue. It is often a leading indicator of future revenue growth.
What is a good sales velocity?
There is no universal benchmark. A good sales velocity depends on your industry, deal size, sales cycle, and business model. Most organizations focus on improving their own velocity over time.
How can I improve sales velocity?
Sales velocity can be improved by:
Increasing opportunity volume
Improving win rates
Increasing average deal size
Reducing sales cycle length
Is sales velocity a leading or lagging indicator?
Sales velocity is generally considered a leading indicator because changes in sales velocity often appear before changes in revenue.
What is the difference between sales velocity and pipeline value?
Pipeline value measures potential revenue. Sales velocity measures how efficiently that pipeline converts into actual revenue.
How can I track sales velocity in HubSpot, Salesforce, or Pipedrive?
Sales velocity can be tracked using CRM data such as opportunities, win rates, deal values, and sales cycle length. Many organizations use dedicated sales performance dashboards to monitor sales velocity trends and identify improvement opportunities.
Ready to Track Sales Velocity in Your CRM?
Dear Lucy helps revenue teams track sales velocity, forecasting, win rates, sales cycle length, and other key revenue growth metrics directly inside Salesforce, HubSpot and Pipedrive.
Start a free trial or book a demo to see how it works.