
Having a large enough, constantly growing pipeline of identified sales opportunities is crucial for sales success and absolutely vital if you’re looking to grow. We are happy to introduce a collection of new sales pipeline development metrics to help you get a full picture of your sales pipeline and its development over time.
(If you would like to jump to the example of a pipeline management dashboard right away, hop onto our live online demo for our “Pipeline Management” sample dashboard.)
According to an article in Harvard Business Review, there is a direct correlation between good sales pipeline management and the company’s revenue growth.
Visibility to pipeline growth is a “must-have” for any company looking to grow. If your sales pipeline does not grow, no growth in sales results can be expected.
However, many sales teams struggle to monitor the development of the sales pipeline over time. The most important data is not easily available in CRM systems and spending time on creating spreadsheets is time spent away from actual sales.
Here’s an introduction to sales pipeline management, and an overview of our new features.
Pipeline Development By Week, 12 weeks rolling. (Click to enlarge.)
What is Sales Pipeline Management?
Sales pipeline - or sales funnel as some call it - is a visual representation of the sales process stages from identifying a sales opportunity to closing the deal.
Ideally, the sales process is well structured, and it also includes descriptions of what needs to be achieved in each stage in order to move the sales opportunity forward.
Sales pipeline management is the process and tools that allow your team to make sure that the pipeline is working: ensuring that the pipeline is growing at the right speed and the sales opportunities are moving along from one stage to the next.
Getting a snapshot view of today’s sales pipeline (how much is our offer base today) is typically rather easy and can be seen from any CRM.
But if you only have visibility to your today’s pipeline - without the ability to monitor progress and trends over time - you don’t really know where you're headed.
The key to successful sales growth is the ability to track sales pipeline progress over time. This is typically more difficult to put in place. Many sales teams spend hours with spreadsheets and manual number crunching in order to get a solid understanding of how their pipeline is developing week over week.
Why Is It important to Manage Your Sales Pipeline?
The value (and evolution) of the sales pipeline is one of the key indicators to predict future success. Hence, sales pipeline growth is one of the key indicators investors are looking to monitor, too.
The only way to guarantee consistent sales results month after month requires that the sales pipeline is large enough at all times. Sales teams need to make sure they have a “healthy pipeline” - a sufficient number of qualified sales opportunities that can close in the following weeks and months.
Typically, the sales results vary from month to month. More often than not, sales teams focus so much on the short-term closing of deals that they forget to work on the future pipeline. So the results may be great one month but terrible the next.
If your team is able to put in place processes and practices that ensure your pipeline is consistently filling up with new qualified opportunities, and the opportunities are systematically progressing through the pipeline, the more likely you are to create steady results.
The team should also react to pipeline “underperformance” immediately.
If you, for example, see a drop in the amount or number of cases in a certain sales process stage in the current week compared to last week, you immediately know that you will have a drop in sales in the coming weeks or months if you don’t take corrective actions.
Who Needs Effective Sales Pipeline Management?
Monitoring of the sales pipeline and its development is important for all sales teams and especially so for the following types of teams:
Sales teams looking to grow sales results need to be monitoring their pipeline religiously. It’s the single most important indicator of future sales growth.
Struggling sales teams who are not closing enough deals or whose sales results are very inconsistent over time.
Companies with a large volume of sales opportunities coming into the sales pipeline.
Example of A Pipeline Management Dashboard
We created a sample dashboard that includes the most typical pipeline management metrics.
Click the image below to enlarge the image or visit our live demo for a live version to see the drill-down tables behind the tiles.
What Are The Key Metrics In Pipeline Management?
Here’s a list of the key metrics in pipeline management. All the metrics can be viewed by pipeline stage or by salesperson.
The key metrics are:
Pipeline development by week (12 week rolling)
Current pipeline vs. pipeline end of last week
Added to pipeline this month - value of cases
Number of deals added to pipeline this week
Average deal length in days
Current weighted pipeline value
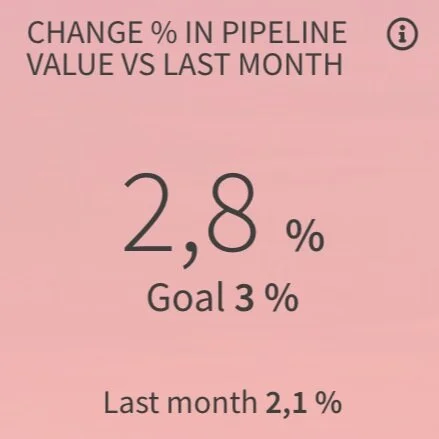
Change % in pipeline value vs. last month
Value of opportunities by close date
Activity levels are many times the prerequisite for being able to add new deals into the pipeline. Hence, we also added one activity related analysis to the dashboard: an illustration of weekly activity levels for the past four weeks and the upcoming 8 weeks. This will indicate whether the team can expect to see an increase in the pipeline in the coming weeks.
For the pipeline metrics, you have several customization options:
The number of pipeline stages is configurable to meet your needs.
If you have several pipeline stages, the stages can be combined to make it easier to see the big picture.
If need be, the early part of the pipeline can be left out.
In short, the new metrics allow you to:
Analyze the development of their pipeline over time per salesperson, business area, country or product
Identify where the pipeline is “too thin” and which corrective actions are needed (which sales reps or business areas need help in filling the pipeline)
See What is a typical speed through the pipeline
Analyze value changes in the pipeline: are sales people “inflating” the pipeline in the early parts of the sales process
Add Goals for Key Pipeline Metrics
The great thing with Dear Lucy is that you can add goals to almost any sales metric that’s crucial to your team. Simply identify the key KPIs for your sales pipeline and add goals in Dear Lucy to keep a constant eye on those key metrics.
The key pipeline-related metrics that we typically see clients add goals to are:
Added to the pipeline this month (value or volume)
Current weighted pipeline value
Pipeline growth %
The goals can be quarterly, weekly or monthly, or even constant throughout the year. When goals are in Dear Lucy, you constantly see the status of the KPI against the goals and the numbers turn red or green to visualize it in real-time. Goals can be defined for the entire company, business areas, pipeline, or individual sales reps.
If you prefer, Dear Lucy can also indicate the variance to goal meaning how much is still missing from the goal. Or if you like, you can also show the difference to the goal as a percentage.
Looking for Examples on Pipeline Metrics?
Visit our online demo for practical examples of pipeline management dashboards and other popular sales KPIs.