
Lead tracking in HubSpot is the heartbeat of every sales organization. From the first contact to qualification, the way you manage and measure HubSpot leads determines how efficiently your team turns activity into revenue. Yet many sales teams discover that HubSpot’s native lead tools only take them part of the way — you can see how many new leads arrive, but not how many progress, convert, or impact your forecast.
TL;DR: HubSpot helps teams capture and manage leads, but native lead tracking often stops short of providing actionable insights. Teams struggle to see how leads progress into deals, measure conversion rates, or forecast pipeline impact. Dear Lucy turns HubSpot leads into visual, real-time dashboards — showing lead stage conversions, source performance, goal pacing, and lead-to-deal conversion, all inside your HubSpot CRM.
Why Lead Tracking in HubSpot Matters More Than Ever
Every sales leader knows that great forecasting starts with healthy lead tracking. Yet for many HubSpot users, lead visibility ends at the contact record or activity list. You know how many new leads came in — but not whether they moved forward, stalled, or turned into real pipeline.
A HubSpot leads dashboard changes that. It connects lead activity to deal outcomes, letting you monitor how effectively your team converts leads into qualified opportunities and ultimately into revenue.
What HubSpot Can (and Can’t) Do with Leads
What HubSpot Does WELL
HubSpot offers a dedicated Leads object designed for early-stage prospecting and qualification. With it, you can:
View and filter all active leads in your CRM (by owner, source, date, or lifecycle stage).
Track key statuses like New, Attempted to Contact, Connected, Qualified, or Disqualified.
Assign leads automatically through workflows and route them to reps based on region or team.
Build reports that show lead counts, basic stage breakdowns, and team activity metrics.
This gives a good foundation for managing inbound and outbound lead flow.
But Where HubSpot Reporting Falls Short
When it comes to analyzing performance or forecasting, HubSpot’s lead tools hit limits. Common frustrations include:
No built-in lead-to-deal conversion reporting – you can’t easily see how many leads became opportunities or closed deals.
Difficulties tracking stage-by-stage conversion rates across the funnel.
Limited goal pacing — HubSpot doesn’t show how current lead volume and conversion rates align with revenue targets.
Fragmented dashboards — reps, managers, and executives often need separate views that HubSpot can’t create without custom work.
Manual reporting — RevOps and SalesOps teams frequently resort to spreadsheets or BI tools to combine lead and deal data.
The result? Teams can’t see where the funnel is leaking or whether today’s leads are enough to hit tomorrow’s sales goals.
What’s Actually Meaningful in Lead Tracking
If you want to run a data-driven sales organization, lead tracking shouldn’t stop at volume. You need dashboards that answer critical questions like:
How many new leads are we generating per month, and where are they coming from?
How efficiently do we move leads through each stage — from New → Attempting → Connected → Qualified?
How long does it take for a lead to convert?
Which sources (inbound, outbound, referral, event) deliver the most qualified leads?
What’s our lead-to-deal conversion rate, and how does it trend over time?
Are we on pace to hit our sales goals based on current lead volume and conversion?
Where are we losing leads — bad timing, wrong fit, technical limitations, or budget?
When you can answer those questions in one dashboard, you can fix what’s slowing your pipeline and double down on what works.
Once you can see how leads move through each stage, you can start forecasting with real precision. Learn how sales teams turn those insights into predictable growth in our guide on HubSpot forecasting.
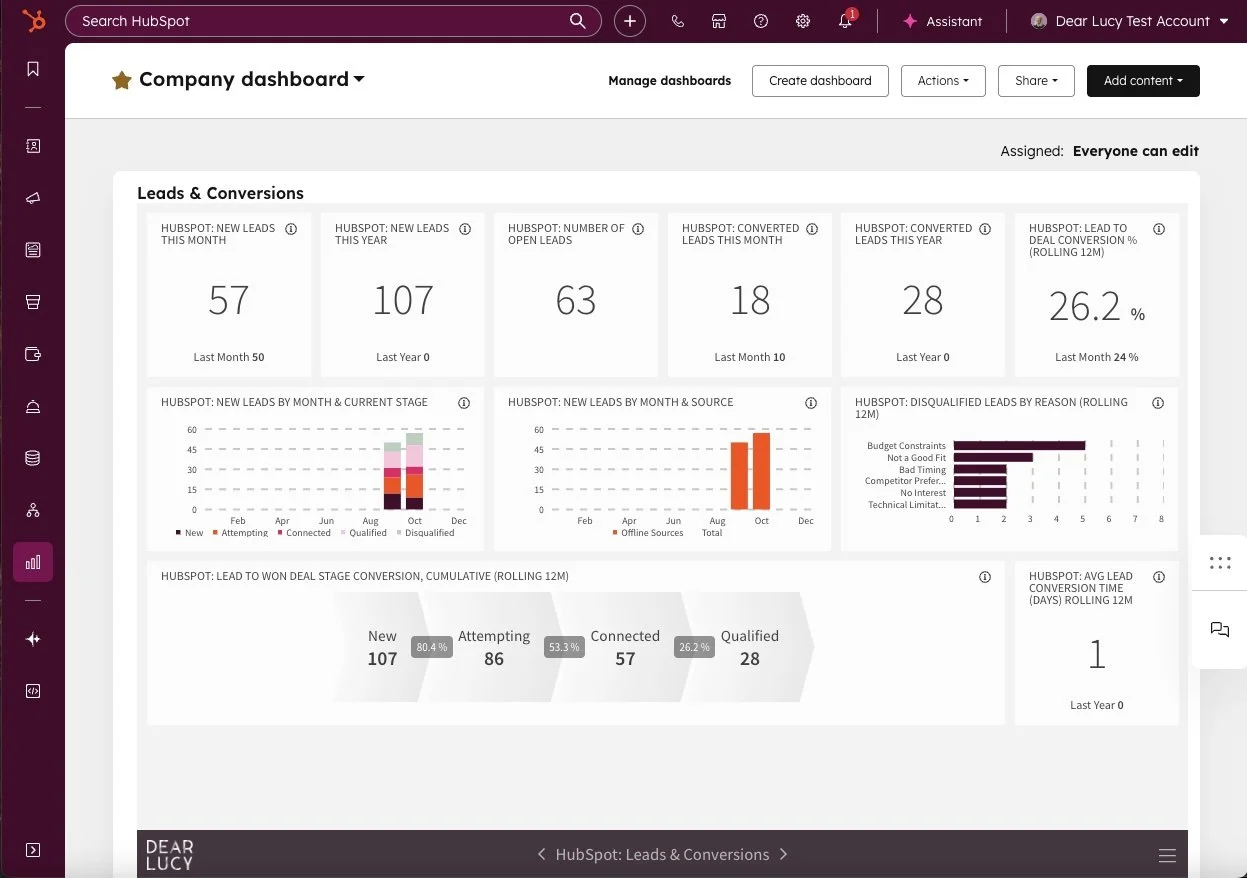
The HubSpot Leads Dashboard — Reinvented by Dear Lucy
Dear Lucy takes your HubSpot lead data and transforms it into clean, actionable dashboards — embedded right inside HubSpot or accessible directly via web, mobile, or TV.
Key Metrics You’ll See Instantly:
Lead Volume & Trend: New leads this month, quarter, and year — with historical comparisons.
Lead Stage Conversion: Stage-by-stage progression showing exactly where leads are stalling.
Lead-to-Deal Conversion: Full-funnel visibility from New → Qualified → Deal Won.
Average Conversion Time: How long it takes to move leads through each stage.
Disqualified Leads by Reason: Visual breakdown of “lost” leads (budget, timing, competition, etc.).
Lead Source Performance: Which campaigns, events, or reps are bringing the most qualified leads.
Goal Pacing & Forecasting: Track monthly and quarterly lead targets — and predict pipeline sufficiency.
Once you can see how leads perform against your targets, goal pacing becomes effortless. See how to set layered sales targets and track progress directly in HubSpot in our guide on HubSpot goals.
And when those leads turn into real opportunities, predictive deal scoring helps you prioritize which ones are most likely to close — and where to focus your team’s energy. Explore how it works in our post on HubSpot deal scoring
Why It Matters
Instead of static lead lists, you get real-time conversion visibility. SDRs and AEs know how their activities perform, managers see stage efficiency, and RevOps gains conversion rates tied to actual deals — not just contacts.
See your HubSpot Leads Dashboard live — connect your CRM, and start turning data into predictable growth. Start your free trial now (no credit card required) →
Dear Lucy vs HubSpot Native Reporting
When you compare Dear Lucy’s dashboards to HubSpot’s native reporting, here’s what you’ll notice:
Lead volume tracking: HubSpot provides basic counts. Dear Lucy adds dynamic trends by owner, source, and region.
Stage conversion: HubSpot’s stage conversion tracking is limited and often requires custom reports. Dear Lucy automatically visualizes funnel conversions and stage-by-stage performance.
Lead-to-deal visibility: In HubSpot, you need manual exports to connect leads to deals. Dear Lucy does it automatically and shows a full-funnel view from lead to closed deal.
Goal pacing: HubSpot offers basic quota tracking. Dear Lucy builds predictive pacing models based on conversion ratios and pipeline coverage.
Role-based dashboards: HubSpot uses shared views that aren’t personalized by role. Dear Lucy delivers tailored dashboards for SDRs, managers, and executives.
Embedded analytics: HubSpot keeps dashboards inside the CRM. Dear Lucy can embed directly in HubSpot and offer standalone dashboards for leadership, boards, or TV screens.
How Teams Use It
SDRs: Track new leads, outreach activity, and conversion to qualified status.
Managers: Monitor stage conversion efficiency, disqualification reasons, and pacing.
RevOps/SalesOps: Analyze lead-to-deal ratios, optimize routing, and ensure coverage for revenue goals.
CROs and Executives: View overall lead performance, campaign ROI, and lead quality trends — all in one place.
Example: What a Healthy Lead Dashboard Looks Like
Imagine opening HubSpot and instantly seeing:
51 new leads this year
23.5% lead-to-deal conversion rate
2.3 days average conversion time
Conversion breakdown by stage (New → Attempting → Connected → Qualified → Won)
Clear disqualification reasons
No spreadsheets. No manual updates. Just clear visibility into whether your team is generating — and converting — enough leads to hit its targets.
Why It Works
Because data visibility drives accountability. When everyone sees lead progress in real time, sales teams act faster, managers coach better, and leadership gains confidence in forecasts.
Dear Lucy’s HubSpot Leads Dashboard doesn’t just visualize data — it turns lead management into a performance driver.
FAQ
Can HubSpot report on leads?
Yes, HubSpot provides basic lead reporting (counts, statuses, and activities). However, it lacks deeper insights into conversion rates, pipeline impact, and forecasting.
Can I see how many HubSpot leads turn into deals?
Not easily. You’ll need to combine leads and deals data manually. Dear Lucy automates this and visualizes lead-to-deal conversion in real time.
Does Dear Lucy replace HubSpot’s lead object?
No — it enhances it. Dear Lucy uses your existing HubSpot data to provide advanced visualization, analytics, and forecasting inside HubSpot’s familiar interface.
Can managers and executives see lead performance by team?
Yes. Dear Lucy dashboards are role-based, showing what matters most to each user (rep, manager, exec).
TL;DR — HubSpot Leads, Elevated
HubSpot tracks leads, but visibility often ends at “qualified.”
Teams lack clear conversion insights, goal pacing, and pipeline predictability.
Dear Lucy fills that gap with dynamic, visual dashboards showing every stage of lead progression, from new to deal won.
About Dear Lucy
Dear Lucy is a certified HubSpot partner and Sales Performance Management platform built for teams that want better visibility into their sales performance. It transforms CRM data into real-time dashboards for forecasting, goal tracking, and pipeline management — all seamlessly embedded inside HubSpot. Learn more at dearlucy.co/hubspot