
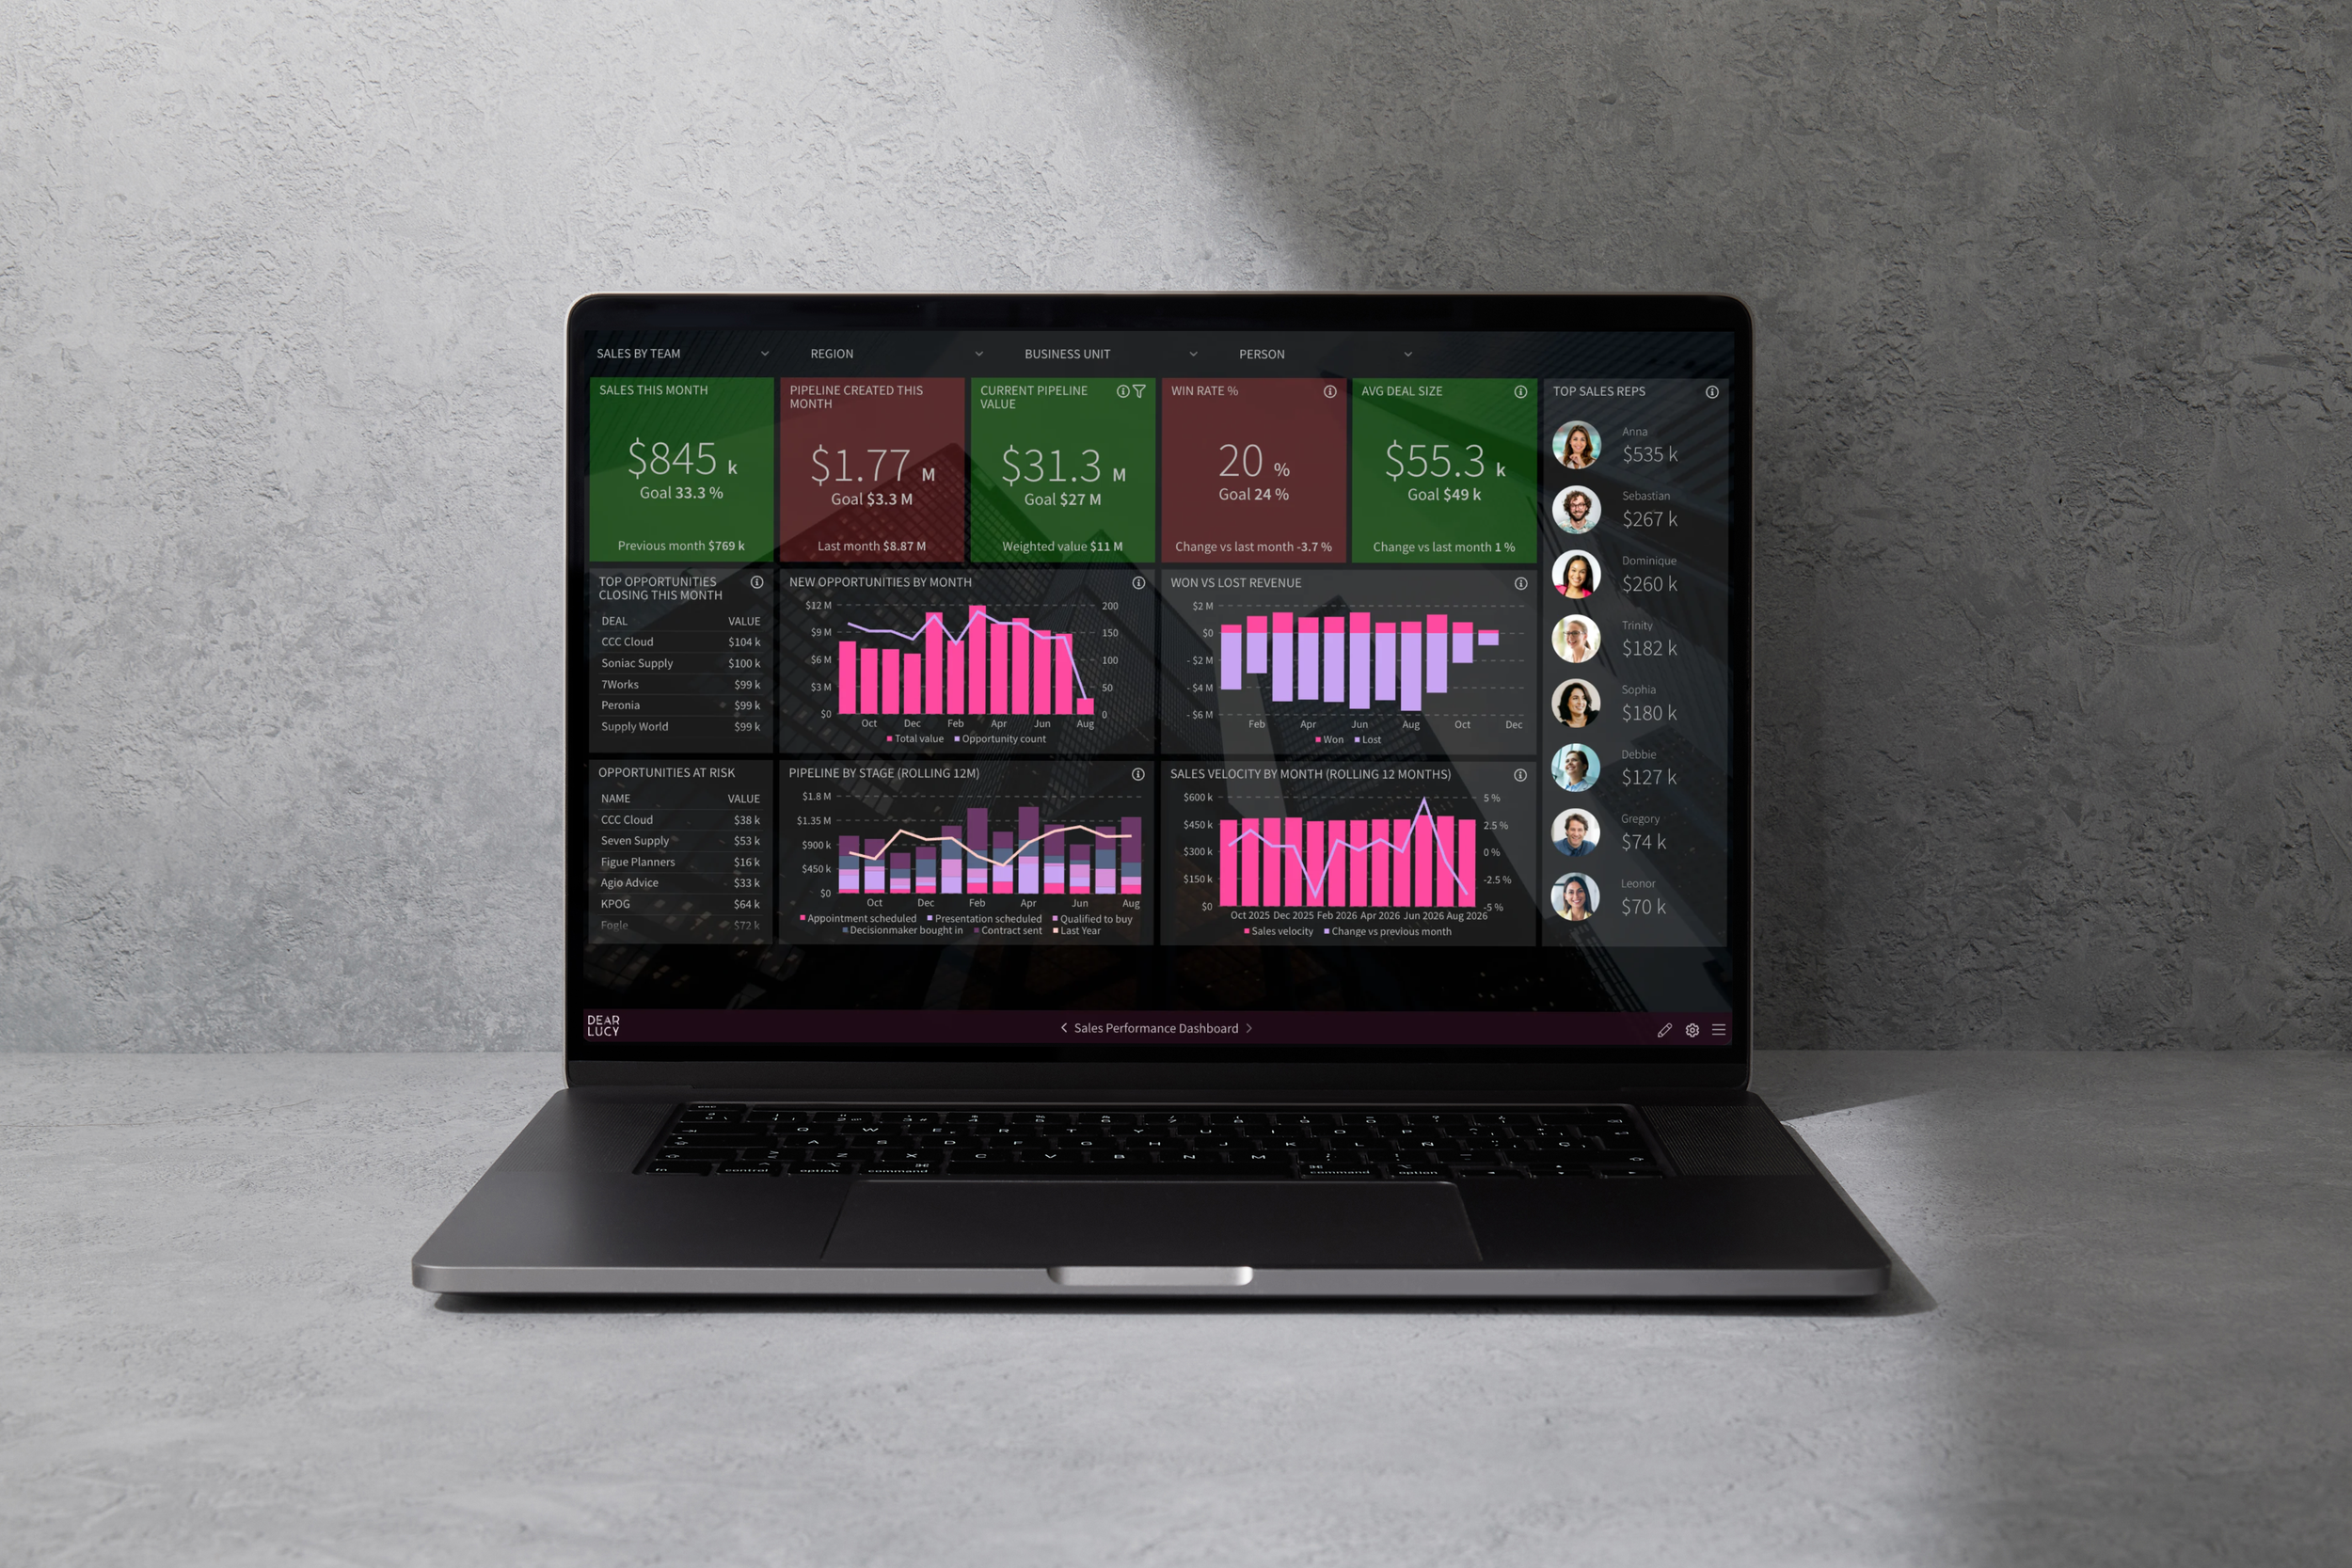
Pipedrive Reporting
Your sales team already loves using Pipedrive.
Dear Lucy transforms your Pipedrive CRM into one trusted source of truth for sales leadership—helping sales managers, RevOps, executives and the board make faster, more confident decisions.
Instead of exporting reports, updating spreadsheets and debating numbers, everyone works from one shared view of sales performance.
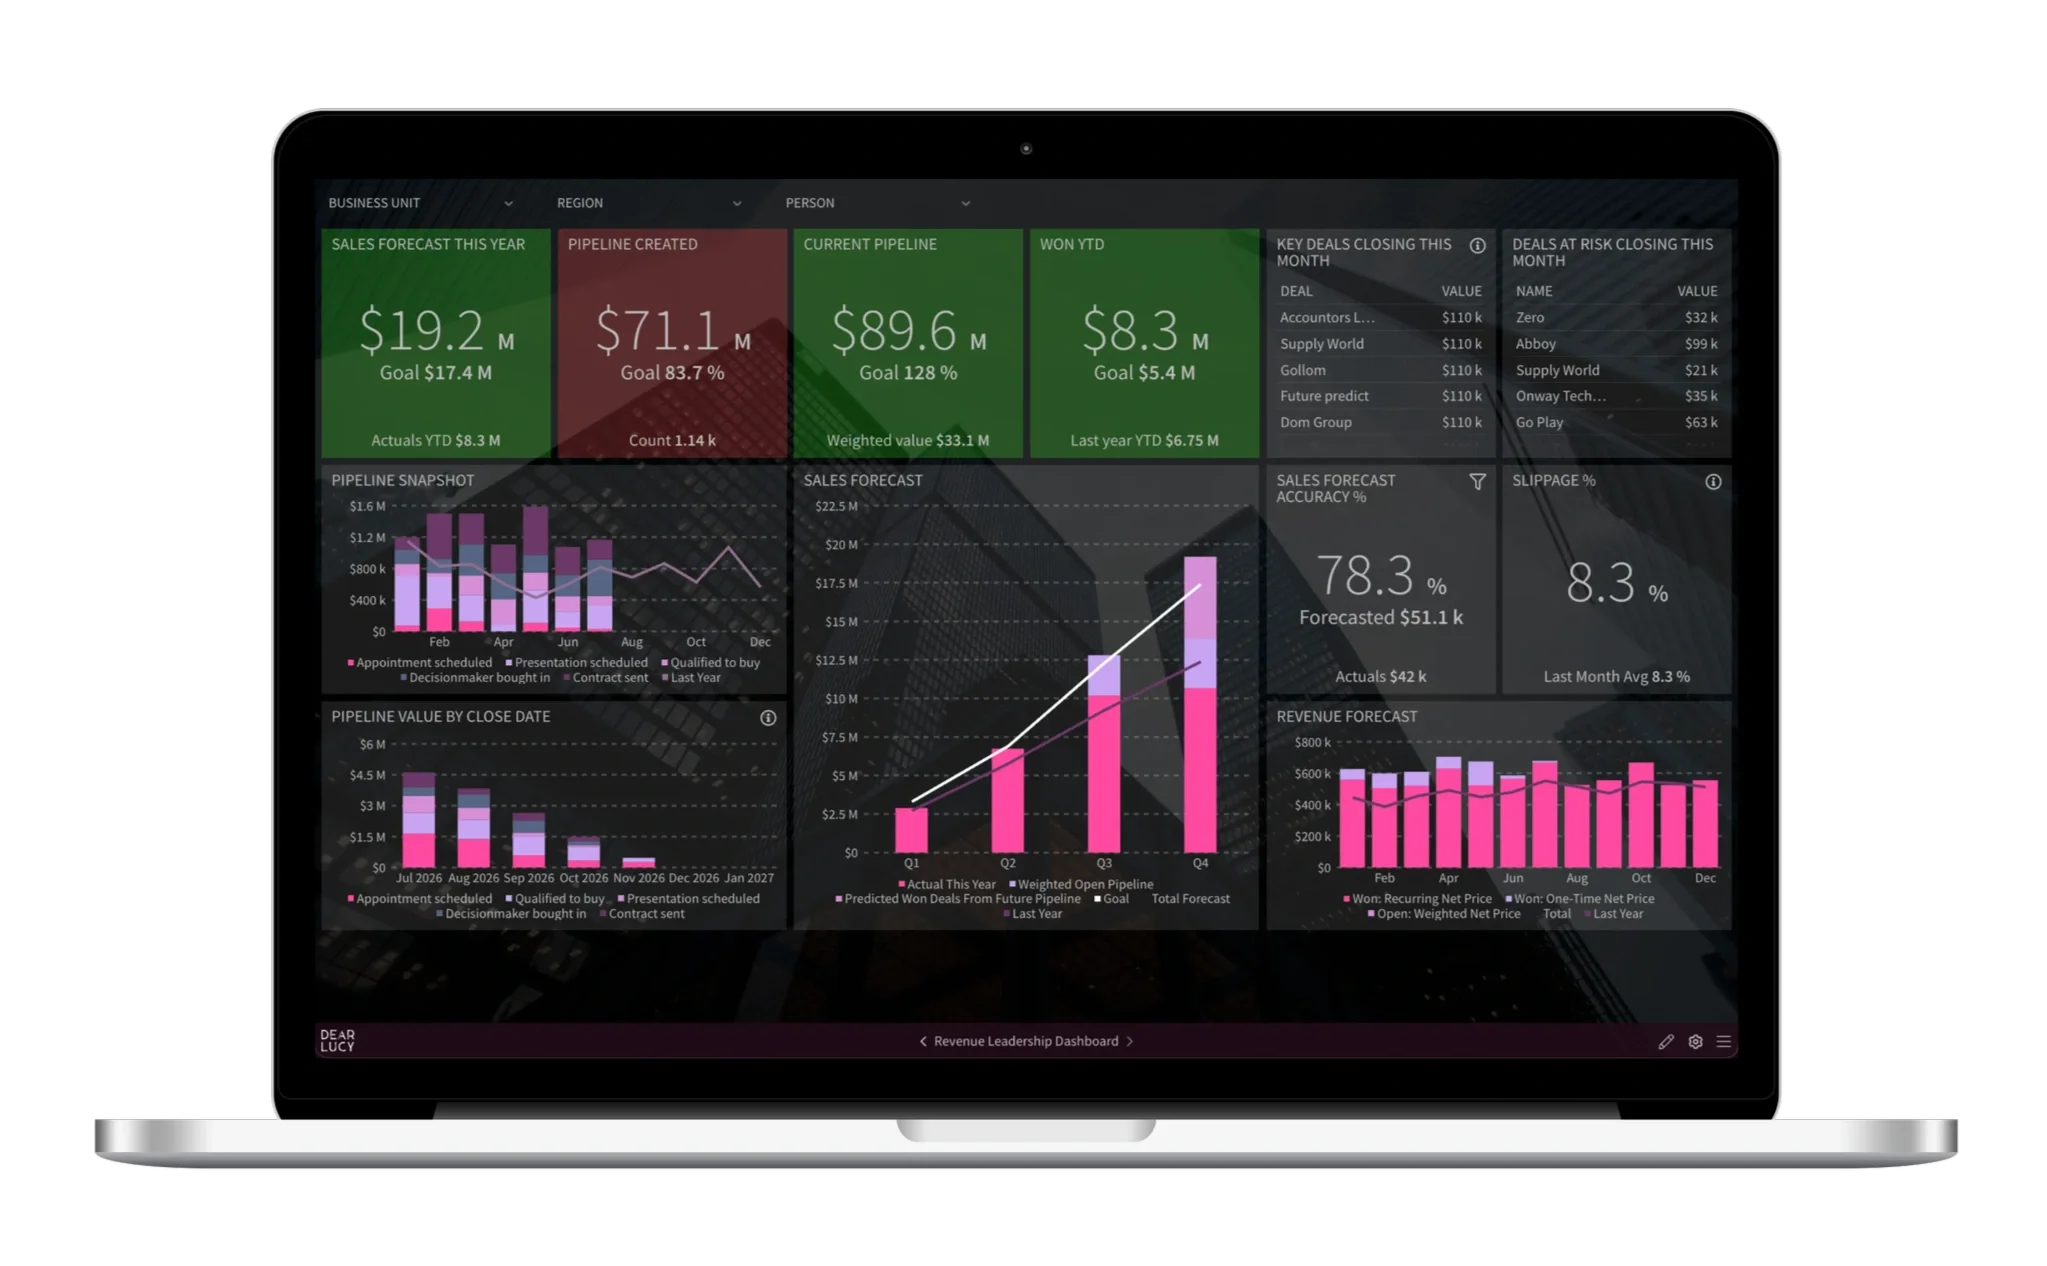
Example of a Pipedrive reporting dashboard combining sales KPIs, pipeline performance, forecasting, revenue reporting and executive insights from Pipedrive CRM.
Better decisions start with trusted sales insights
Sales leaders make hundreds of decisions every week—from pipeline reviews and forecast calls to sales coaching, executive meetings and board reporting.
Every one of those decisions depends on the quality of the information behind it.
When everyone works from different dashboards, exported CRM reports or spreadsheets, meetings quickly become debates about the numbers instead of discussions about what to do next.
Great Pipedrive reporting isn't just about creating reports. It's about giving sales leadership one trusted view of sales performance.
Dear Lucy transforms your Pipedrive CRM into one trusted reporting system for sales leadership, giving everyone the confidence to make faster, data-driven decisions.
One shared view of sales performance
Your sales team already uses Pipedrive to manage opportunities, track activities and move deals through the pipeline.
Dear Lucy builds on that foundation by turning your CRM data into a complete reporting layer for sales leadership.
Every dashboard updates automatically from your Pipedrive CRM, so sales managers, RevOps, executives and the board all work from the same live information.
Instead of maintaining separate reports for different audiences, everyone shares one trusted view of sales KPIs, pipeline performance, sales forecasting, revenue forecasting, sales goals and executive reporting.
The result is simple.
Fewer spreadsheet exports.
No conflicting reports.
More confident forecasting.
Better decisions across the entire organisation.
Built for every sales leadership conversation
Sales reporting isn't the goal.
Better leadership conversations are.
Every dashboard in Dear Lucy is designed around the meetings your sales organisation already runs.
Whether you're preparing for Monday's pipeline review, a weekly forecast call, a sales rep 1:1, an executive meeting or next month's board presentation, everyone arrives looking at the same numbers.
That means less time preparing reports, less time debating data and more time coaching, solving problems and making decisions.
Dear Lucy supports every stage of sales leadership, including:
Pipeline reviews
Understand pipeline health, deal movement, bottlenecks and conversion rates before discussing individual opportunities.
Forecast calls
Review forecast accuracy, pipeline coverage and forecast confidence using live CRM data.
Sales rep 1:1s
Coach individual reps using live KPIs, goals and pipeline insights instead of anecdotal updates.
Sales manager reviews
Compare team performance, identify coaching opportunities and monitor goal attainment across regions or business units.
Executive dashboards
Give leadership instant visibility into revenue performance, pipeline health and strategic sales KPIs.
Board reporting
Replace manually prepared board packs with real-time dashboards that update automatically from Pipedrive.
Sales goals
Track targets across sales reps, managers, regions and business units with live progress indicators.
Revenue forecasting
Look beyond today's pipeline to understand future revenue and longer-term business performance.
What sales leaders need from Pipedrive reporting
Pipedrive includes powerful reporting capabilities through Pipedrive Insights, allowing teams to build reports, dashboards and performance visualisations directly inside the CRM.
For many organisations, that's an excellent place to start.
As sales organisations grow, however, reporting usually expands beyond operational dashboards.
Leadership starts asking broader questions.
Are forecasts becoming more accurate?
Is enough pipeline entering the funnel?
Which teams consistently hit target?
Where are deals slowing down?
How has pipeline changed over the last six months?
What should we present to the board next week?
That's where reporting evolves from individual reports into a complete sales leadership system.
Rather than replacing Pipedrive, Dear Lucy builds on top of it—bringing together historical reporting, advanced forecasting, executive dashboards, recurring revenue insights and role-based reporting while continuing to use your existing CRM as the single source of operational data.
Ready-to-use Pipedrive reporting dashboards
Rather than starting with empty dashboards, Dear Lucy gives you proven reporting frameworks used by modern revenue teams.
Sales Performance Dashboard
Monitor sales performance with live sales KPIs, pipeline creation, top sales reps, win rate, average deal size, opportunities at risk and sales velocity—all in one dashboard.
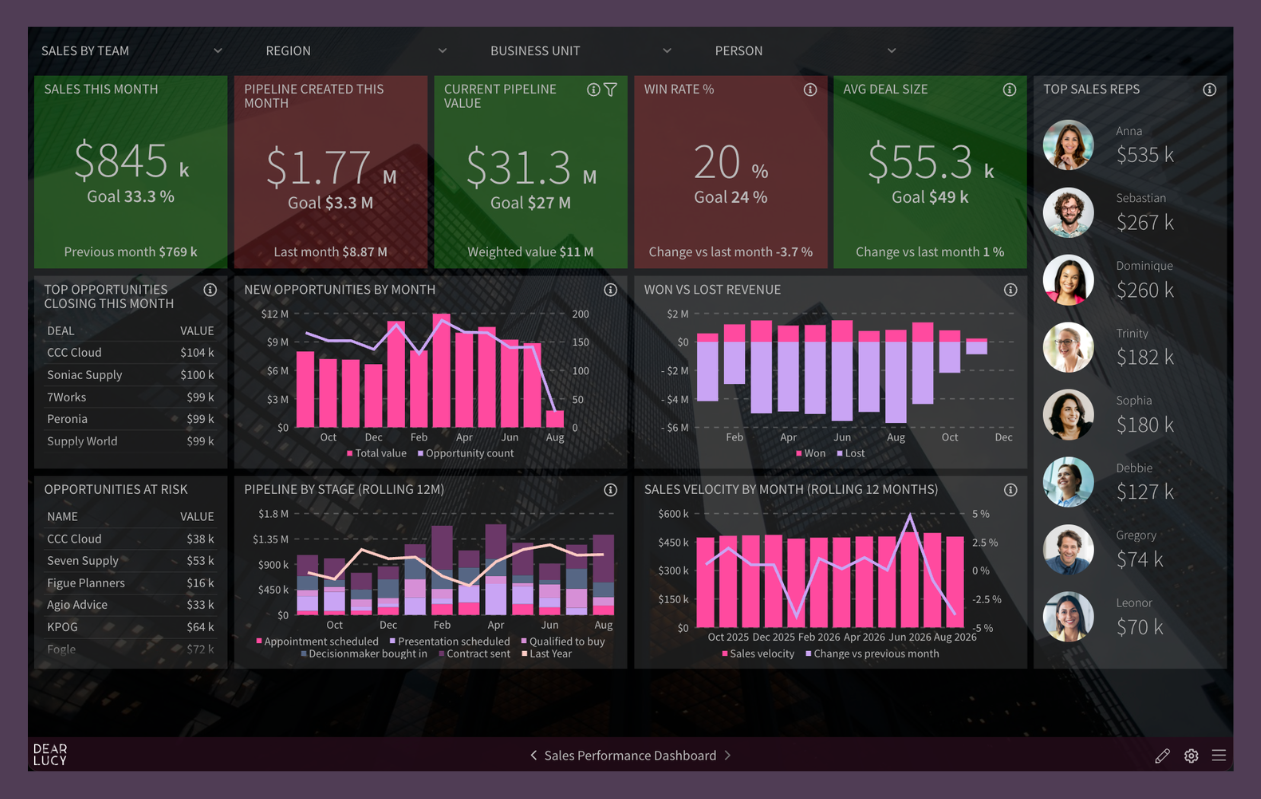
Sales Performance Dashboard built for Pipedrive. Monitor sales KPIs, top performers, pipeline creation, deal quality and sales velocity in one live dashboard.
Forecast Dashboard
Run more confident forecast calls with live sales forecasts, pipeline coverage, forecast accuracy, deal risk and best case vs. commit forecasts—powered directly by your Pipedrive data.
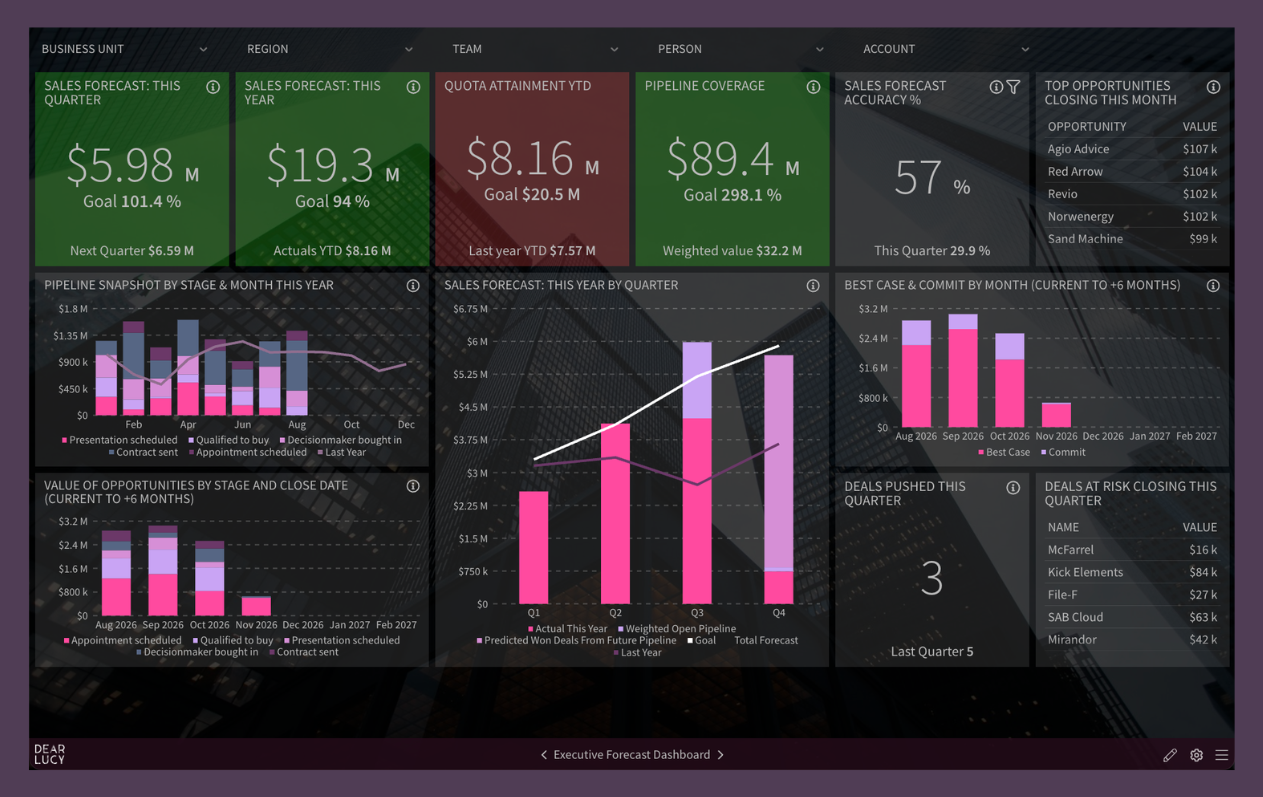
Executive Pipedrive sales forecast dashboard showing sales forecasting, pipeline coverage, forecast accuracy, quota attainment, deal risk and top opportunities.
Pipeline Dashboard
Monitor pipeline health, stage conversion, sales velocity, deal movement and pipeline trends over time to identify risks before they impact revenue.
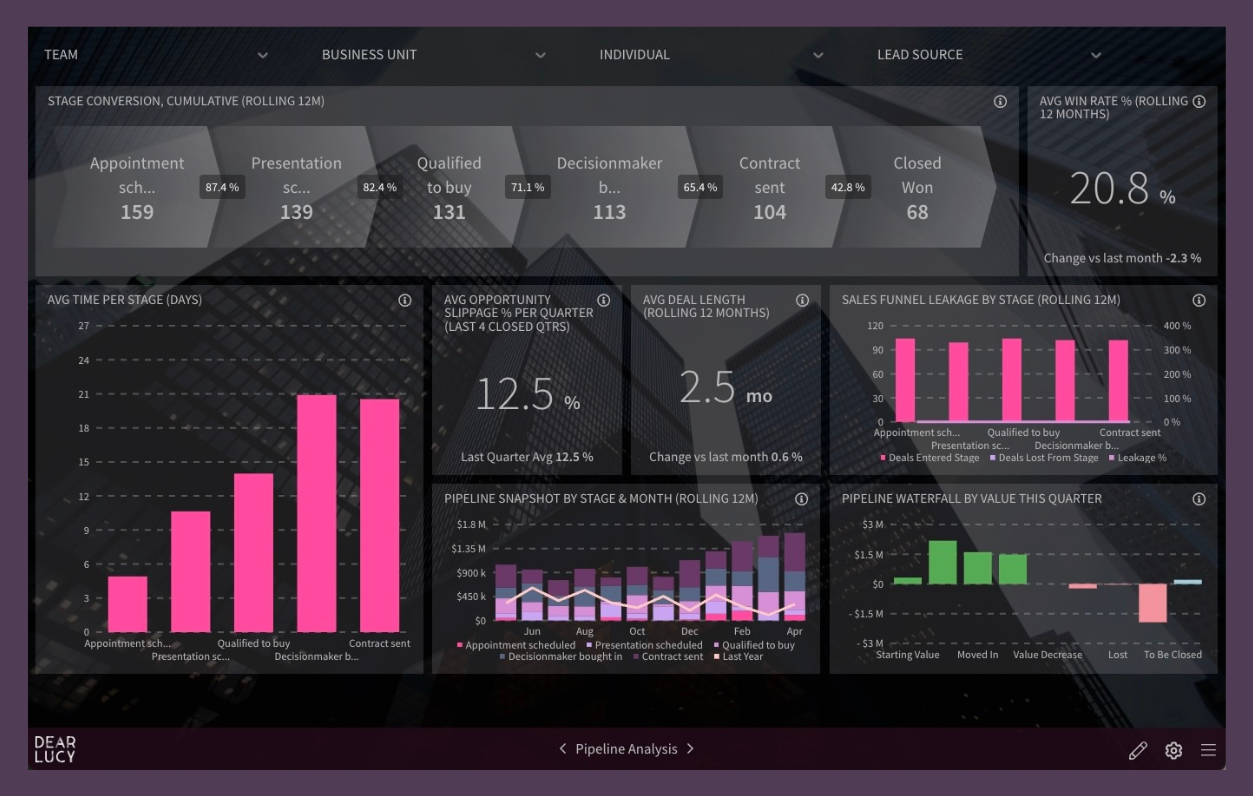
Understand pipeline health, stage conversion, sales velocity, deal movement and pipeline leakage in one live dashboard powered by your Pipedrive CRM.
Explore more Pipedrive dashboards
These are just a few examples. Dear Lucy includes ready-to-use dashboards for sales reps, sales managers, RevOps, executives, board reporting, CRM hygiene, pipeline reviews, forecast calls and office TV displays.
→ Explore Pipedrive dashboards
Looking to improve your forecasts?
Forecast accuracy starts with healthy pipeline reviews—not gut feel.
Learn how to run better forecast calls using live sales forecasts, forecast accuracy, pipeline coverage, predictive revenue forecasting and opportunities at risk.
Built on proven sales leadership best practices
Great Pipedrive reporting isn't about visualising more data.
It's about helping sales leaders make better decisions.
Dear Lucy includes hundreds of built-in sales KPIs, calculations and reporting models developed from years of working with sales leaders.
Instead of designing reports from scratch, you start with a proven framework and adapt it to your business.
Built-in best practices include:
Pipeline health
Goal pacing
Forecast accuracy
Revenue forecasting
CRM hygiene
Executive scorecards
Sales velocity
Pipeline coverage
Deal movement
Win-rate analysis
The questions every sales leader should answer in under 30 seconds
The best sales organisations don't spend leadership meetings searching for numbers.
They spend them making decisions.
Your reporting should instantly answer questions like:
Will we hit this quarter?
Which opportunities are most at risk?
Is enough pipeline being created?
Which teams need coaching?
Which goals are off track?
Is forecast accuracy improving?
How has pipeline changed over time?
Are we building enough future revenue?
If those questions take hours to answer, your reporting isn't working hard enough.
Live in minutes
Connect your Pipedrive CRM.
Your dashboards appear automatically.
No BI implementation.
No SQL.
No spreadsheet exports.
No building reports from scratch.
Within minutes, your sales organisation can start reviewing live sales performance using dashboards built on proven sales leadership best practices.
Looking for the full Pipedrive integration?
Learn how Dear Lucy integrates with Pipedrive, what data is supported, how the setup works and how to get started in minutes.
→ Explore Dear Lucy for Pipedrive
Frequently Asked Questions
Does Pipedrive have reporting?
Yes. Pipedrive includes reporting through Pipedrive Insights, allowing users to create reports and dashboards directly inside the CRM.
What is Pipedrive Insights?
Pipedrive Insights is the CRM's reporting module used to build reports, dashboards and performance visualisations from your sales data.
Can I create custom reports in Pipedrive?
Yes. Pipedrive supports custom reports using filters, custom fields and different visualisations.
Can I build executive dashboards from Pipedrive?
Yes. Many organisations use dedicated reporting platforms like Dear Lucy to create executive dashboards while continuing to use Pipedrive as their CRM.
How do I improve sales forecasting in Pipedrive?
Forecasting improves when historical pipeline trends, forecast accuracy, deal movement and pipeline health are reviewed together—not only current pipeline value.
Can I track sales goals using Pipedrive?
Yes. Dear Lucy extends Pipedrive with layered sales goal tracking across individuals, teams, regions and business units.
Can I share dashboards with executives and the board?
Yes. Dashboards can be securely shared across your organisation so everyone works from the same live data.
Is Dear Lucy an official Pipedrive integration?
Yes. Dear Lucy is available on the Pipedrive Marketplace and connects directly to your Pipedrive CRM. It extends Pipedrive with advanced sales reporting, forecasting, sales goals, executive dashboards and revenue forecasting while keeping your sales team working in the CRM they already know.
View on the Pipedrive Marketplace →
Turn your Pipedrive CRM into a sales leadership platform.
Keep the CRM your sales team already loves.
Give sales leadership the trusted insights they've been missing.
Run better pipeline reviews.
Forecast with confidence.
Track every sales goal.
Report to leadership without spreadsheets.